Ángel Carrión-Tavárez
Director of Research and Policy Puerto Rico Institute for Economic Liberty
Edwin R. Ríos
Economist and ex Assistant Secretary for Economic and Financial Affairs at the Puerto Rico Department of Treasury
“Every specific tax, as well as a nation’s whole tax system, becomes self-defeating above a certain height of the rates.” —Ludwig von Mises (1949, p. 734)
1. Introduction
Taxes have a long history that dates back to the earliest civilizations. Records indicate that 3,000 years ago, tributes were imposed in China to support the military. In Egypt, collectors levied a tax on the farm growth of households, for the house of the pharaoh. Ancient Greece leaders taxed citizens (and visitors) to finance wars, returning monies they did not use. The Roman Empire imposed several taxes, including a tariff on imports and exports, an inheritance tax, and a sales tax. The word “tax” comes from the Latin taxare, meaning “to assess” (Dieterle, 2020).[1]
In its wider historical and functional context, taxes are defined as “unrequited sacrifices government demands from its citizens,” as a political devise for promoting its vision of the general welfare. These sacrifices are “a potentially unequal government-coerced exchange as the value of what one receives—if discernible—is not a function of the value of what one relinquishes.” Calling a tax a required sacrifice “means it matters not whether the sacrifice is made cheerfully, grudgingly, or unwittingly; [what matters is that] it is required because government sanctions for noncompliance exists” (Morris, 2020, pp. 3, 29, 33).
Since taxes constitute “a compulsory transfer of resources from the private sector to government,” they generally do not entitle “a quid pro quo (that’s why it has to be compulsory).” Tax liability—what is owed to the government—“may be triggered by a wide variety of things, such as receiving income,” owning property, purchasing certain goods or services (Burman & Slemrod, 2020, p. 6), or even engaging in certain transactions; for this reason, the tax system of any society “is the aspect of government that directly affects more people than any other” (Slemrod & Bakija, 2017, p. 5).
Over time, governments began to take on an increased number of obligations, which included investment in the development of infrastructure (Lindert, 2004), the creation of state-owned enterprises in productive sectors, the management of media outlets, and the massive financing of private companies, among others. To cover the costs of these new functions, rulers “sought to find ways to diversify the sources of revenue” (Mares & Queralt, 2015, p. 6) with tax potential. The development of large-scale spending and investment programs transformed the state, which ceased to be merely a provider of security and became a central actor in all areas of economic life.
This transformation was possible, to a large extent, “after the adoption of the income tax and its unprecedented revenue-generating capacity.” This tax expanded “the extractive capacity of the state because its adoption went hand in hand with the development of institutions” to identify income and collect more money (Mares & Queralt, 2025, p. 2).[2] Historiographic studies of the moment in which states permanently implemented income taxes have uncovered and documented that non-democratic countries with restrictive suffrage rules pioneered their adoption (Aidt & Jensen, 2009; Mares & Queralt, 2025, p. 3).
“Tax non-compliance is one of the greatest obstacles that revenue administrations face.” The way in which the goal of increasing revenue is pursued has important implications. “Collecting taxes through aggressive enforcement and coercion is more costly than encouraging taxpayers to collaborate with tax collectors” (Mascagni, 2018, p. 273). When people perceive that the government is transparent and acts legitimately, they are more willing to fulfill their part of the social contract. Low corruption and government accountability are necessary conditions for societies to have successful tax performance (Bird et al., 2008).
Perspectives on what constitutes an appropriate level of taxation could come from different perceptions people have regarding “the trustworthiness and efficiency of government.” They may also be influenced by how people perceive their usefulness or by concerns “over how tax revenue will be spent” (Stantcheva, 2021, p. 2). In some cases, discontent with taxes “arises from a deep-seated opposition to allowing government to play an active role in society or from a belief that the government is wasting money.” Another common grievance with tax systems is their excessive complexity.[3] For many, complying with “labyrinthine tax regulations is frustrating, costly, and intrusive” (Slemrod & Bakija, 2017, pp. 6, 7).
Although the tax liability is not voluntary, both the amount owed for a given tax and certain aspects of its planning or filing generally depend “on voluntary decisions made by people or corporations” (Burman & Slemrod, 2020, p. 6). Individuals frequently make decisions with short-, medium-, and long-term implications, based on the tax rules in effect (Burman & Slemrod, 2020); therefore, those rules must be not only fair, but also clear. It is important to keep in mind that “not all government revenue is labeled a tax. Forms of taxation are all around in our everyday life,” extending beyond those we formally recognize as taxes (Dieterle, 2020, p. 10).
1.1. Context of the Study
Research published between 2022 and 2024 places Puerto Rico last in the ranking of economic freedom among U.S. jurisdictions.[4] Likewise, the most recent report on ease of doing business ranked Puerto Rico as the least favorable U.S. jurisdiction for starting, managing, and growing a business.[5] One of the factors contributing to the Island’s poor performance in these indices is its tax environment; nevertheless, Puerto Rico is absent from comparative studies on taxation conducted in the United States and other countries due to the lack of reliable data on its tax types and rates. This research aims to fill that gap.
1.2. Rationale for the Study
In Puerto Rico, there is no record of prior work comparable in scope and objectives to the one proposed in this study. Although numerous tax reforms have been carried out over the years, these have focused on fiscal adjustments rather than one of economic and social development. Such reforms have included changes to tax rates as well as other specific adjustments, without addressing the system as a whole from a structural and comprehensive perspective.[6] Even fewer have considered the effects of the current system on individuals’ right to economic freedom, whose fundamental principles are embedded in both the Constitution of Puerto Rico and that of the United States.
Currently, the Government of Puerto Rico has launched a reform initiative aimed at simplifying the revenue system, advancing fiscal equity, and easing the tax burden[7] on individuals. This report also seeks to contribute clarity and direction to that initiative. The research conducted offers an analysis of the current tax system on the Island, with emphasis on its operation and fiscal performance. To that end, various aspects of the tax system are examined from both a normative and quantitative perspective, in order to provide evidence that facilitates an understanding of the situation and of Puerto Rico’s standing within the U.S. tax context.
1.3. General Objective
To evaluate Puerto Rico’s tax system and compare it with the tax systems of the 50 U.S. states, through an analysis of its structure, revenue levels, tax burden, and other relevant fiscal indicators.
1.4. Specific Objectives
- Identify and describe the main categories of taxes in effect in Puerto Rico, their bases, rates, and revenue levels.
- Examine the tax treatment of Puerto Rico residents under the U.S. federal system.
- Calculate the total taxes paid in Puerto Rico by individuals and businesses, both residents and nonresidents.
- Determine Puerto Rico’s tax burden, based on taxes collected and selected economic indicators.
- Compare the structure of Puerto Rico’s tax system and tax burden with those of the 50 U.S. states, based on total state and local[8] taxes paid.
- Compare Puerto Rico’s taxation and fiscal burden with those of the 50 U.S. states, based on total federal, state, and local taxes paid.
1.5. Summary of Main Findings
Puerto Rico has ten categories of state and local taxes, with different tax bases and various types and rates. In addition, federal taxes are paid, with collections in fiscal year 2023 totaling $5,390 million—comparable to Vermont’s collections that year. Of this total, $3,674 million corresponded to contributions to the federal social security systems, and $1,716 million to other tax categories. Residents of Puerto Rico paid more in federal taxes than in local taxes, which totaled $2,311 million that same year. In other words, residents paid $2.33 in federal taxes for every dollar paid in local taxes in 2023.
Puerto Rico’s distribution of state and local taxes is more concentrated than the average of the U.S. states, as it relies on just two types of taxes for 69.6% of revenues: taxes on the consumption of goods and services, and corporate taxes. Corporate taxes exhibit the most pronounced disparity between the two jurisdictions, with the Island’s proportion being 4.4 times higher. In contrast, the share of property taxes is significantly lower in Puerto Rico (7.3%) than in the United States (27.4%), reflecting lower cadastral valuations, reduced tax pressure on real estate, and a less developed institutional framework for enforcement.
The individual income tax in Puerto Rico accounts for 21.2% of total collections by type. This tax is characterized on the Island by its progressivity and concentration. A revealing fact is that 495,516 taxpayers—equivalent to 40.1% of returns filed—had no tax liability in 2023. Those reporting incomes of up to $40,000 (around 467,313 taxpayers, or 63.0%) contributed only 9.2% of total revenue. By contrast, taxpayers with incomes above $100,000—representing 7% of returns—contributed more than 62.2% of the total, reflecting the system’s high structural dependence on this segment.
The distribution of state and local tax revenues by type shows that Puerto Rico’s tax system relies more on the individual income tax than the tax systems of 15 states—9 of which do not levy a personal income tax. When considering total combined taxes—federal, state, and local—individuals and businesses, both residents and nonresidents in Puerto Rico, paid $23,281 million. Of that amount, 87.4% is concentrated in three categories: (a) individual and corporate income taxes, $7,424 million (31.9%); (b) consumption taxes on goods and services, $7,381 million (31.7%); and (c) social security contributions, $5,532 million (23.8%).
Puerto Rico’s state and local tax burden, whether measured by GDP (13.6%) or GNP (17.3%), is higher than that of the 50 states. Meanwhile, the total combined burden—including federal, state, and local taxes—amounts to 18.2% based on GDP and 23.9% based on GNP. This latter figure (23.9%) is higher than that of 12 states, equal to that of 2, and just one percentage point lower than in ten other states. This means that, even though Puerto Rico is not fully integrated into the federal tax system, the tax burden on its residents is greater than or comparable to that of 24 states where all federal taxes are paid.
2. Methodology
2.1. Type of Study
This study is descriptive, quantitative, analytical, comparative, and cross-sectional. It systematically and thoroughly presents the structure of Puerto Rico’s tax system, including its categories, types of taxes, tax bases, and revenues. It also addresses and analyzes tax income, fiscal burden, and per capita taxation, enabling a critical interpretation of the data collected. In addition, it establishes contrasts between Puerto Rico’s tax system and those of the 50 U.S. states, examining available data corresponding to a specific fiscal year in each jurisdiction: fiscal year 2023 for Puerto Rico[9] and fiscal year 2022 for the United States.[10]
2.2. Methodological Design
The study was structured in several phases aimed at collecting, systematizing, analyzing, and presenting relevant information on the tax systems of Puerto Rico and the 50 U.S. states. First, an extensive literature review was conducted on tax-related topics, both conceptual and applied, to contextualize the analysis within the appropriate theoretical and technical framework. This review included academic studies, institutional reports, and public policy documents. It also examined the Puerto Rico Internal Revenue Code of 2011 (2011/2025), the Código Municipal de Puerto Rico (2020/2025 [Puerto Rico Municipal Code]), as well as various laws, regulations, and standards from both Puerto Rico and the United States.
Next, the taxes in effect that were relevant to the study and their main characteristics were identified, including tax base, legal structure, rates, and administrative mechanisms. Once the tax universe was defined, statistical data were collected on revenues from these taxes in Puerto Rico and in the 50 U.S. states. This information was obtained through consultation of official documents and institutional websites of government entities such as the Departamento de Hacienda (Department of Treasury), the Junta de Planificación (Planning Board), the Centro de Recaudación de Ingresos Municipales (CRIM, Municipal Revenue Collection Center), the United States Census Bureau (USCB), the Internal Revenue Service (IRS), and other official sources.
Using the data on federal, state, and municipal taxes collected by state, the following indicators were calculated: (a) tax burden, (b) per capita tax, and (c) relative distribution of tax revenues. Figures and statistical tables were then prepared for Puerto Rico, the U.S. average, and each of the 50 states. The work carried out in this phase enabled standardized and objective comparisons across the various tax systems. Subsequently, the results were analyzed to identify patterns, significant differences, and relevant aspects for understanding Puerto Rico’s tax system and its relationship to U.S. jurisdictions.
A database with updated information on the taxes studied in Puerto Rico was then created to provide a structured, detailed, clear, and accessible description of the tax system. This database includes an index and a reference guide for each type of tax and its rates, based on the provisions of the Puerto Rico Internal Revenue Code of 2011, the Puerto Rico Municipal Code, and other applicable legal sources.[11] Finally, this technical report was drafted to present the work conducted and the results of the study, with the aim of contributing empirical evidence that enhances understanding of Puerto Rico’s tax system and its relationship to that of the United States.
2.3. Definition and Classification of Taxes and Other Sources of Government Revenue
The definition and classification of taxes in this report are based on the interpretive guide to tax statistics of the Organisation for Economic Co-operation and Development (OECD).[12] As defined in its criteria, “the term “taxes” is confined to compulsory unrequited payments to the general government or to a supranational authority. Taxes are unrequited in the sense that benefits provided by government to taxpayers are not normally in proportion to their payments” (OECD, 2023, p. 6).[13] In fiscal terms, these are coercive payments intended to enable the State to provide collective services, such as public order and the judicial system.
Direct taxes are those levied on income and applied to natural or legal persons (such as corporations). Indirect taxes, by contrast, are applied to the use of money—that is, to the consumption of goods and services or the acquisition of certain assets (Gómez-Barroso, 2022, p. 84). The latter are charged uniformly to all individuals, regardless of income level or purchasing power. Taxes are grouped into different categories according to the tax base—the monetary value of the taxable item or specific units—on which they are levied. These categories include taxes on income, property, wealth, general consumption, and specific transactions. Revenues are generated by applying the tax type and rate to the corresponding tax base.
Taxes are not the only source of government revenue. Governments also collect funds through: (a) fees for services provided by the public sector or for private use of public assets; (b) dividends from investments, income from public property, and interest on loans granted; (c) sales of financial assets, business shares, or real estate; (d) non-compulsory transfers received without compensation from the private sector, other administrations, or supranational organizations; (e) issuance of public debt; (f) operation of lotteries; (g) imposition of fines (Gómez-Barroso, 2022); and (h) royalties from the exploitation of natural resources, among others.
3. Structure of Puerto Rico’s Tax System
The structure of a society’s tax system refers to the set of tax categories established by a government to raise the resources needed to finance its expenditures and services, in accordance with its economic and social policies. It defines how taxes affect individuals and their decisions to work, invest, and save. Taxes also influence business decisions related to production, investment, innovation, and job creation (OECD, 2010). In this way, the structure of a country’s tax system affects the economic behavior of individuals, social groups, and institutions (Dieterle, 2020), and may reflect the overall standard of living.
The tax categories within a tax system are specific to each jurisdiction and depend on its socioeconomic characteristics and public policies. It is common for countries to combine different categories for various purposes. The mix of taxes, as well as their relative weight and rates, varies from one place to another. In Puerto Rico, individuals and businesses pay taxes at the federal, state, and municipal levels.[14] Using the OECD’s tax classification guide as a reference, Puerto Rico has ten main tax categories with distinct tax bases, each comprising multiple and diverse types of taxes.
3.1. Taxes on Income
“Albert Einstein is reputed to have said that “the hardest thing in the world to understand is the income tax.”” Yet understanding it is essential, as it represents a critical mechanism through which governments shape the lives of individuals (Slemrod & Bakija, 2017, p. vii). Broadly speaking, income tax is progressive—meaning that the tax rate increases as income rises (Burman & Slemrod, 2020).[15] In Puerto Rico, this category encompasses taxes on gross income (after allowable deductions), as well as on capital gains, interest, and dividends. These taxes apply to individuals, corporations, partnerships, and other entities such as trusts, estates, nonprofit organizations, and those subject to special tax regimes.
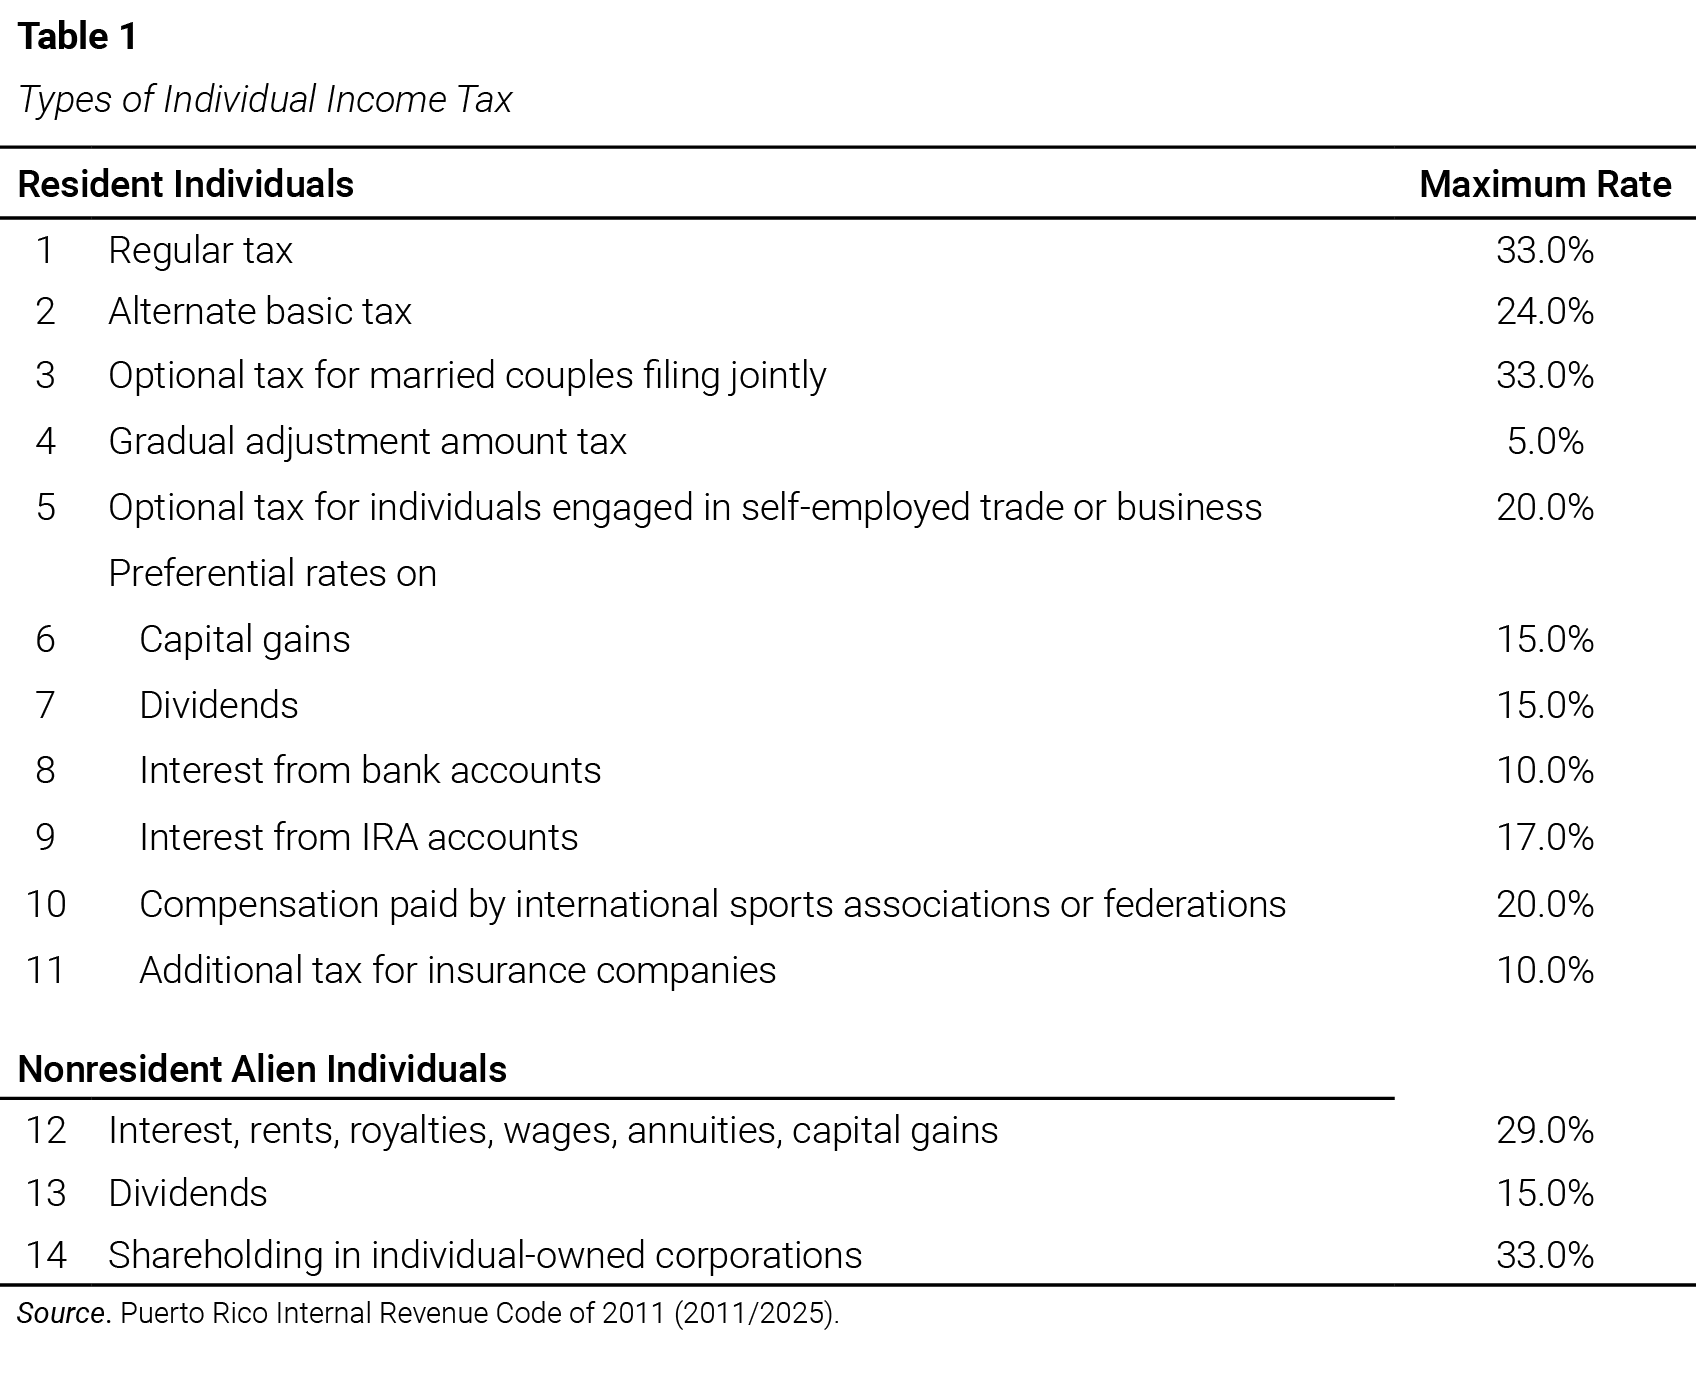
For individual income tax, the applicable rate depends on several factors, including the taxpayer’s income level, source of income, marital status, and the economic activity of the industry or business. Table 1 outlines the various types of individual income tax and their corresponding maximum rates. There are 14 types of taxes that may apply to individuals under different circumstances. Some are mutually exclusive, while others may be applied concurrently. For resident individuals, at least 11 types of taxes may apply depending on the aforementioned factors. For nonresident individuals, three types of taxes are levied based on the source of income.
The regular individual income tax has a progressive rate structure, in which the tax burden increases as the income level rises.[16] This progressivity is intensified by the application of the earned income tax credit, a mechanism that reduces or eliminates the tax liability for lower incomes and may even result in refunds. Statistical data published by the Departamento de Hacienda (n.d.) indicate that during tax year 2023, a total of 1,236,709 income tax returns were filed; of these, more than half—695,568 returns, equivalent to 56.2%—claimed the earned income tax credit, which represented a total disbursement of $1,303 million.
Another relevant indicator of progressivity and concentration in the individual income tax is that 495,516 taxpayers—equivalent to 40.1% of the returns—reported no tax liability; that is, they paid no income tax. Regarding the distribution of tax liability by income level, a basic progressivity analysis shows that taxpayers with incomes of up to $40,000 (approximately 467,313 individuals) contributed only 9.2% of total collections. In contrast, taxpayers with incomes above $100,000, who represent only 7% of the returns, contributed more than 62.2% of all income tax collected.
It could be assumed that the difference between individual and corporate income tax lies in who writes the check.[17] In the tax treatment of corporate income tax, there are multiple tax types, as in the case of individuals. The first is the normal tax, with a rate of 18.5%. This is followed by the additional tax, which consists of a series of progressive marginal rates, depending on the level of net income, with a maximum rate of 19.0%. The alternative minimum tax applies depending on the income level. There are also options for preferential rates on certain types of income. Table 2 shows the 11 types of corporate taxes identified.

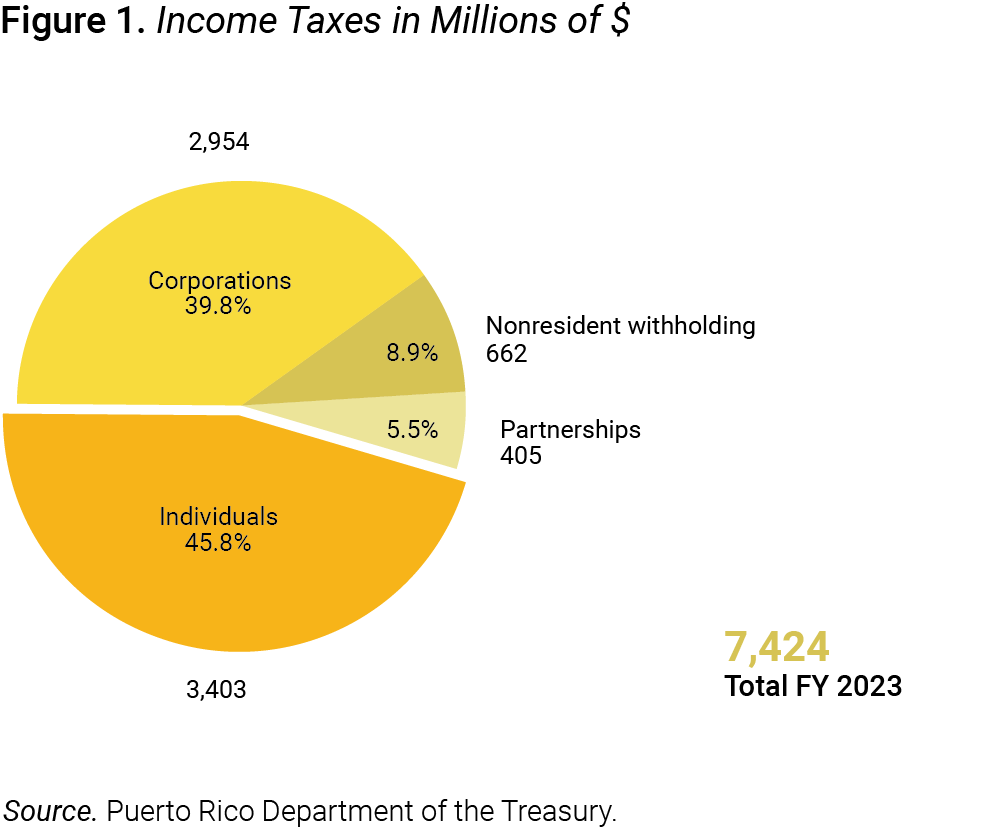
Total General Fund revenue—the main fund for the Government’s expenses—from income tax was $7,424 million in fiscal year 2023.[18] The tax paid under the individual income tax was the largest in this category, with $3,403 million, equivalent to 45.8%. This amount is before deducting the Government’s share of the $448 million earned income tax credit (Financial Oversight and Management Board for Puerto Rico, 2024). Ley Núm. 41 (2021) amended the Puerto Rico Internal Revenue Code of 2011 to incorporate the earned income tax credit provisions into the individual income tax regime.
Through the enactment of the American Rescue Plan Act (2021), the Biden administration extended the Earned Income Tax Credit program (IRS, 2025a) to Puerto Rico. In 2023, the total earned income credit was $1,115 million, of which the federal government contributed $667 million, and the state government contributed $448 million from individual income tax revenue. Following the individual income tax, in order of importance, were: (a) corporate income tax, with a total of $2,954 million, equivalent to 39.8% of total income tax revenue; (b) nonresident withholdings, with $662 million, equivalent to 8.9%; and (c) partnerships, which paid $405 million, or 5.5%.
3.2. Property Taxes
Taxes on the use, ownership, or transfer of property represent a significant revenue source in many jurisdictions. In Puerto Rico, these taxes are levied by the municipalities and apply to both real and personal property. The tax rates for real and personal property consist of a combination of the basic levy, the additional special levy, and the supplemental levy. The first two rates vary by municipality, while the third is fixed by law. Real property assessments—including land, buildings, permanent installations, and any element permanently affixed to the ground—are based on estimated replacement cost as of 1957.
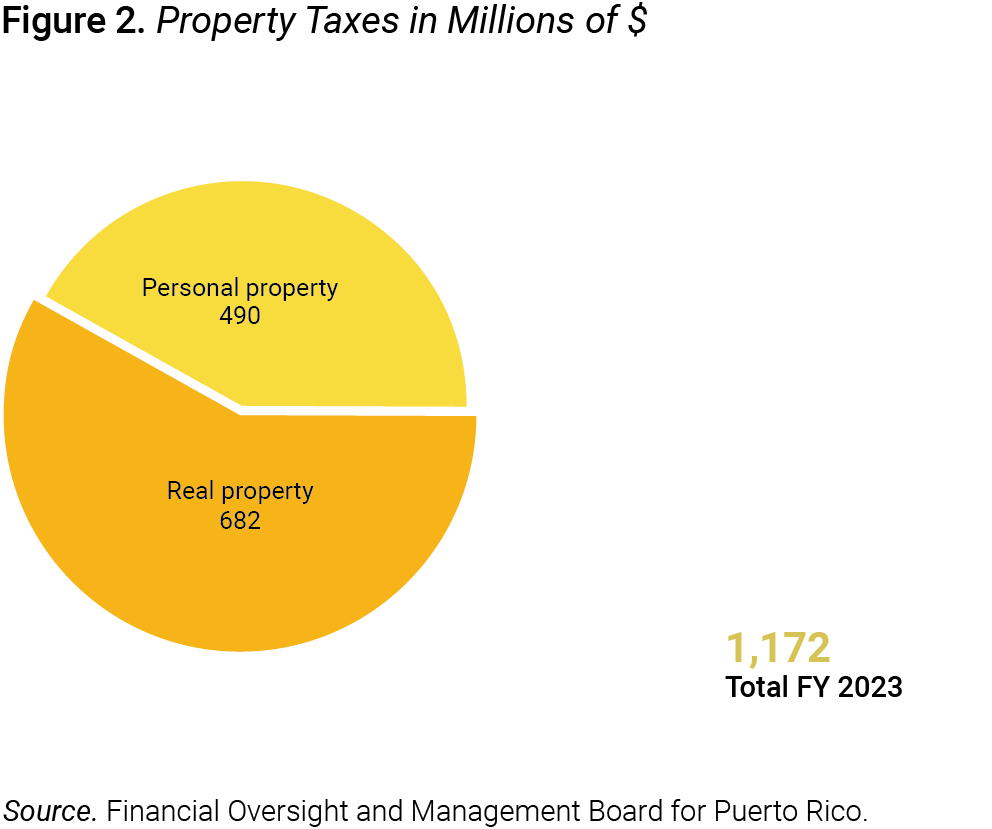
The lowest real property tax rate is 8.03%, currently applicable in Orocovis, while the highest rate of 12.33% applies in Cidra, Lajas, Ponce, and Río Grande.[19] The personal property tax—which covers items not affixed to the ground, such as vehicles, machinery, and equipment—also varies by municipality. Ceiba has the lowest rate at 5.80%, while the municipalities of Cidra and Lajas have the highest at 10.33%. Total property tax revenues in 2023 amounted to $1,172 million; of this, real property taxes accounted for $682 million or 58.2%, and personal property taxes for $490 million or 41.8%.
Inventory held by manufacturers, merchants, or dealers constitutes a component of the personal property tax. The Puerto Rico Municipal Code defines it as the portion of property owned by any manufacturer, merchant, or dealer consisting of stock of goods or other items for sale.[20] This type of property is “accounted for separately and valued based on the average annual inventory during the calendar year preceding the valuation date, as recorded in the books of said manufacturers, merchants, or dealers” (2020/2025, p. 402). This tax is estimated at $260 million, representing 53% of total taxable personal property levies.
According to Daley and Coates, property taxes stand out for their fiscal efficiency, as—when properly designed and broadly applied—they have little impact on “incentives to work, save, and invest. Unlike capital, property is immobile—it cannot shift offshore to avoid higher taxes.” Following this reasoning, they argue that concerns “about the risks of multinational tax avoidance, the increasing mobility of capital around the world, and the increasing value of residential property relative to incomes, should make property taxes a priority in any tax reform” (2015, p. 1).
3.3. Estate and Gift Taxes
The Puerto Rico Internal Revenue Code of 2011 eliminated the estate tax for individuals who passed away on or after January 1, 2018. Collections totaled approximately $1 million in 2023; therefore, the tax treatment of this levy has limited relevance to Puerto Rico’s fiscal revenues.[21] Subsection “4.3. Estate Taxes” of this report addresses the applicable tax treatment for a U.S. citizen residing in Puerto Rico who owns assets within the 50 states at the time of death. The provisions of the federal Internal Revenue Code on this matter are generally not well known on the Island.
3.4. Taxes on Goods and Services
All general taxes applied to the manufacture, production, or wholesale and retail sale of goods fall under this category. These include the Sales and Use Tax (SUT, known as IVU for its Spanish acronym) and the municipal license tax (patente). The SUT consists of a 10.5% rate levied by the central government and a 1% municipal rate, for a combined general rate of 11.5%. The municipal portion includes unprepared food items. The SUT also features a reduced rate of 6.0% plus the 1% municipal rate—totaling 7%—for prepared foods, and a separate 4% rate known as the Special SUT (IVU-Especial) for designated professional services and services rendered to other merchants. This Special SUT is a business-to-business tax.
The SUT is applied to the final consumer price, covering the sale, use, consumption, and storage of taxable goods, which include tangible property, taxable services, and admission rights. In general, the SUT excludes certain items and services, such as goods purchased for resale, prescription medications, goods acquired by manufacturing plants, goods and services intended for export, real property rentals, financial services, and healthcare services (Ríos, 2007). Total SUT revenues for fiscal year 2023 reached $3,711 million. Table 3 details the revenue distribution by tax type.
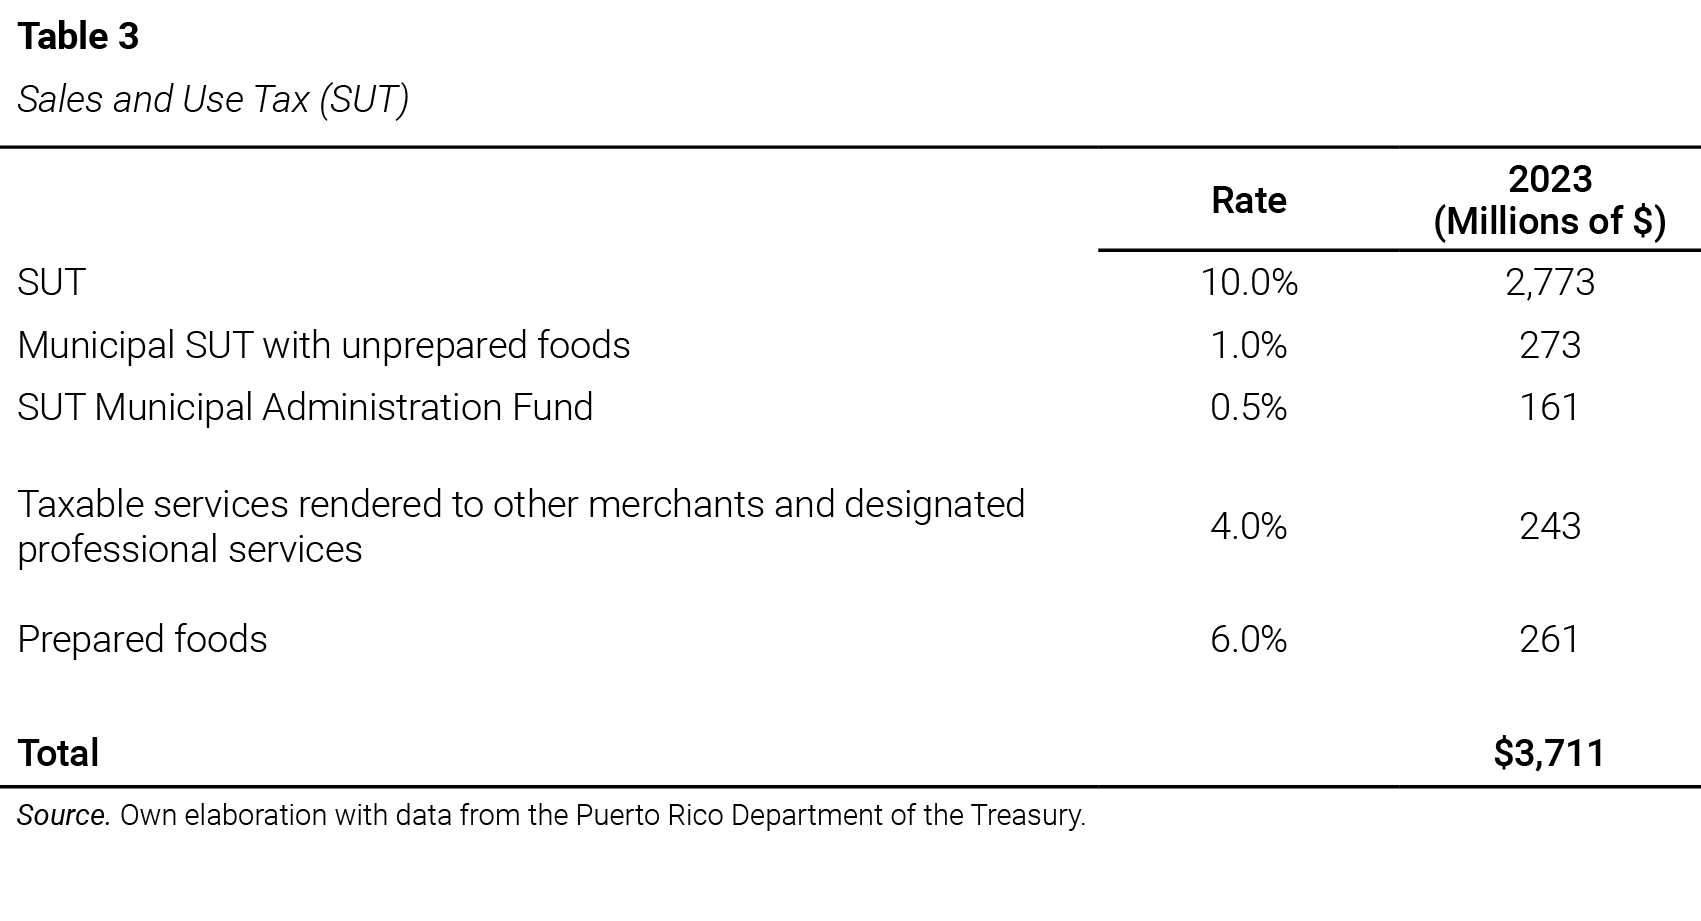
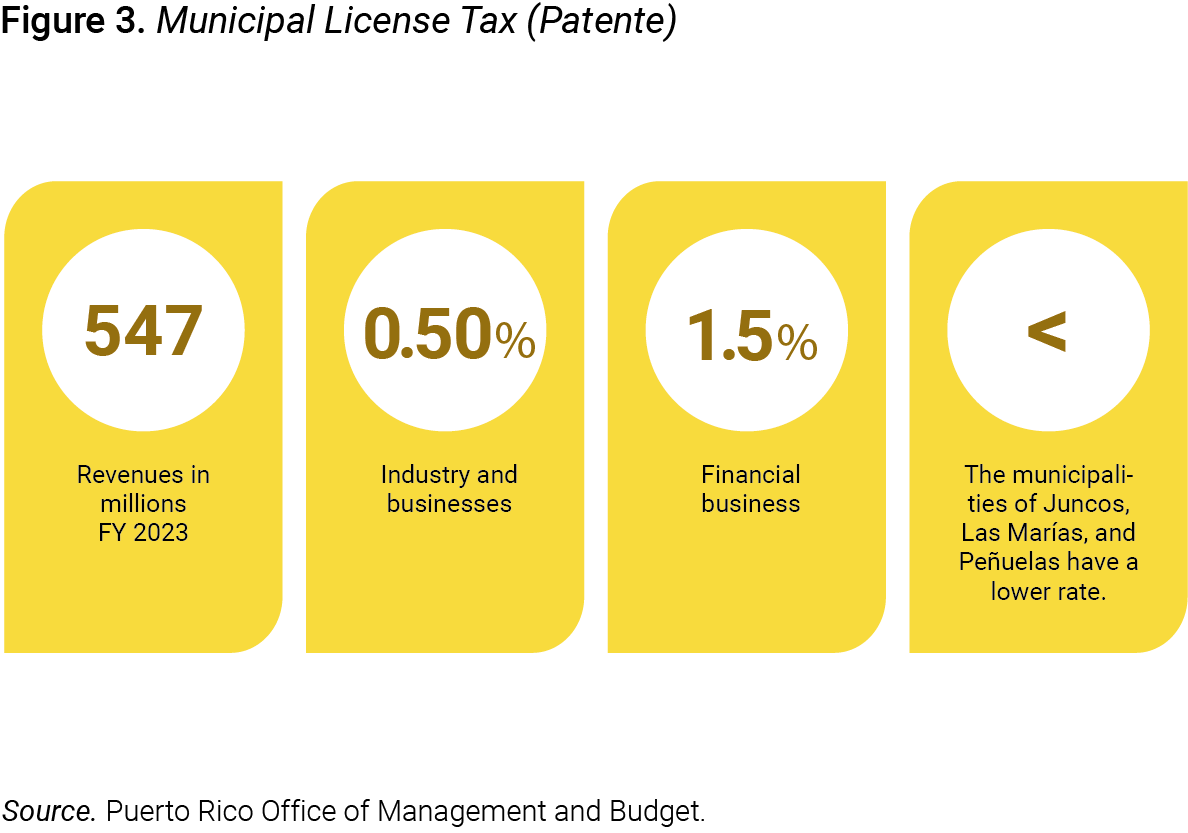
The “Taxes on Goods and Services” category includes taxes levied on gross receipts. The municipal license tax is one such example. The tax base of the municipal license tax is gross receipts (known in Puerto Rico as “business volume”), which refers to the gross income earned from the provision of any service, the sale of any good, or any other industry or business activity. In most municipalities, the applicable tax rate for industry and business is 0.5%. In the case of financial businesses, the rate generally does not exceed 1.5%. In total, municipal revenues from the license tax amounted to $547 million.[22]
3.5. Taxes on Goods (Excise Taxes) and Certain Transactions
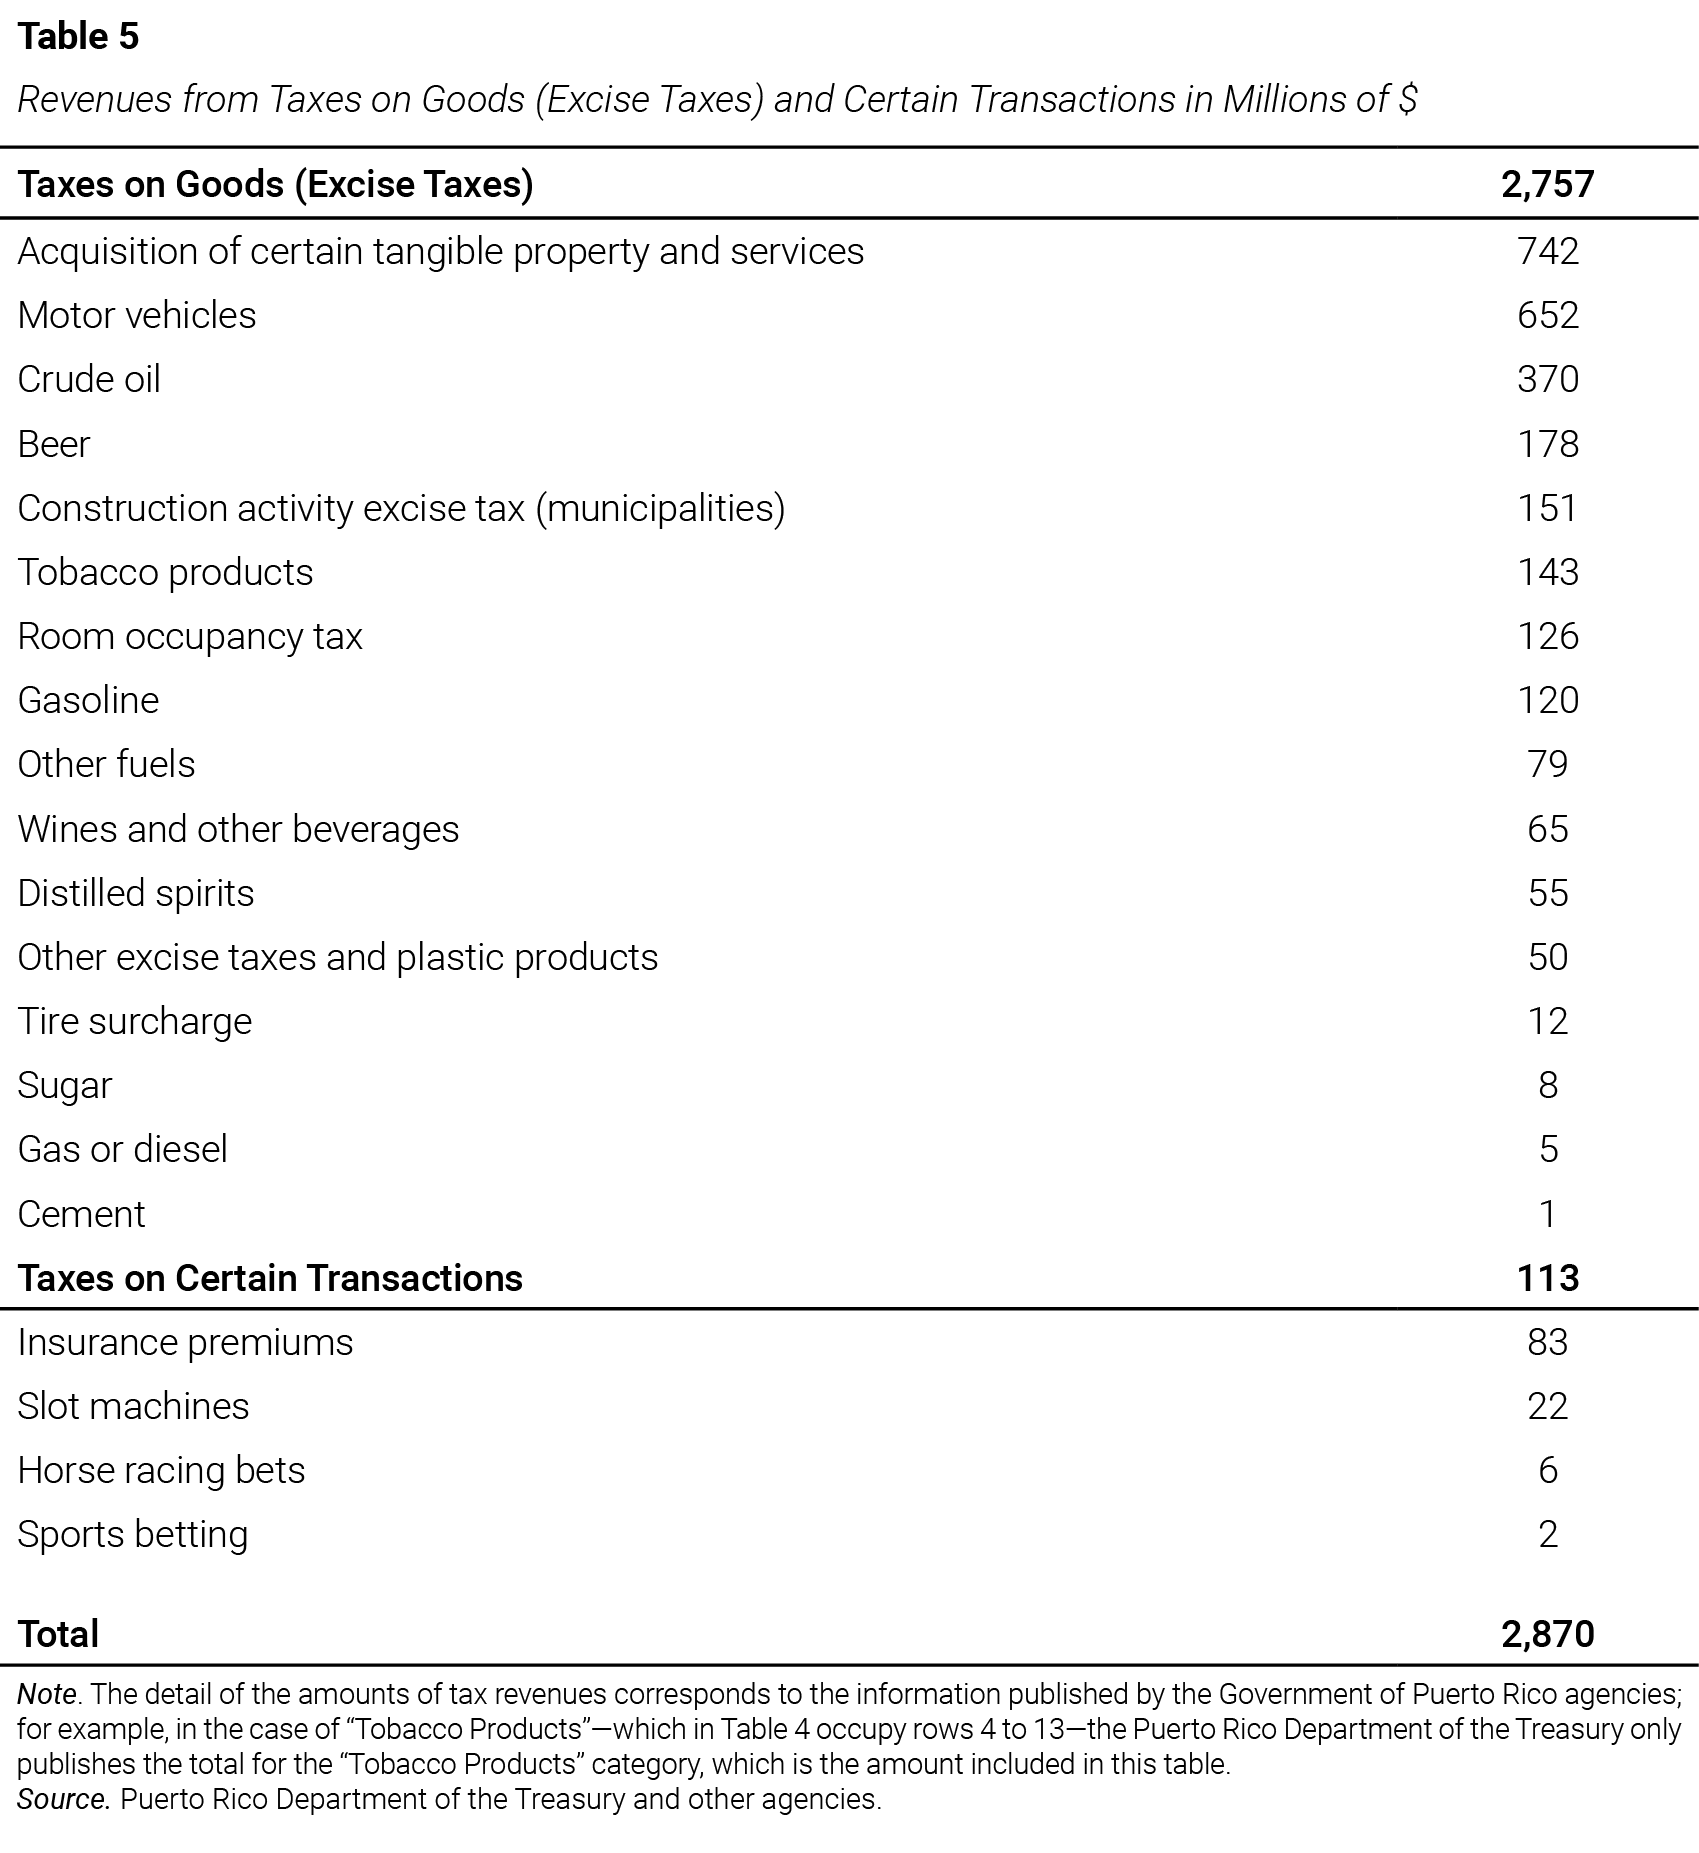
Taxes on goods (excise taxes) are levied per unit of a product within a predefined and limited range. These taxes are generally applied at differentiated rates to specific goods, often luxury or non-essential items such as alcoholic beverages and tobacco products. Taxes on certain transactions, by contrast, are calculated based on the monetary value of the exchange. This category includes levies on betting, games of chance, and insurance premiums, among other taxes.[24] Table 4 presents a list of taxes on goods (excise taxes) and certain transactions, commonly referred to as arbitrios, and Table 5 shows the corresponding fiscal revenues for 2023. Arbitrios are applied at various tax rates detailed in the appendix.

3.6. Coffee Import Duty
Coffee is both an agricultural product and a basic consumer good in Puerto Rico. The United States Congress authorized the Puerto Rico Legislative Assembly to impose a tariff on all coffee imports, from anywhere in the world—including the United States—for use, consumption, and sale.[25] Currently, the tariff is $2.50 per pound of roasted or ground coffee and $1.25 per pound for coffee preparations in any form other than raw, roasted, or ground.[26] This tariff is collected by the U.S. Customs and Border Protection and transferred to the Government of Puerto Rico after deducting administrative service costs. Revenue from the coffee tariff totaled $3 million in 2023.
3.7. Social Security Contributions
“Social Security is a so-called pay-as-you-go system. This means it is a tax-and-transfer system in which taxes collected from today’s workers fund benefits for today’s beneficiaries. ... There’s no saving or investing that takes place. Payroll taxes collected today are spent immediately” (Boccia, 2024). In most countries, these benefits are considered transfers to individuals because their allocation is not based on strictly actuarial criteria but rather follows social patterns. In this study, Social Security contributions are considered taxes, since public benefits are not directly tied to the payments made by taxpayers.
This category includes all mandatory payments to public administrations that confer a right to receive a future social benefit. Such payments are typically earmarked for financing social benefits and are often made to general government institutions that provide those benefits. The Junta de Planificación ([JP], 1996) national accounts define Social Security contributions as payments made by employees and employers to social insurance and welfare systems such as: Federal Old-Age & Survivors Insurance, government retirement and pension systems, Fondo del Seguro del Estado (State Insurance Fund), unemployment insurance systems, and the Fondo de Seguro de Choferes (Chauffeurs’ Insurance Fund).
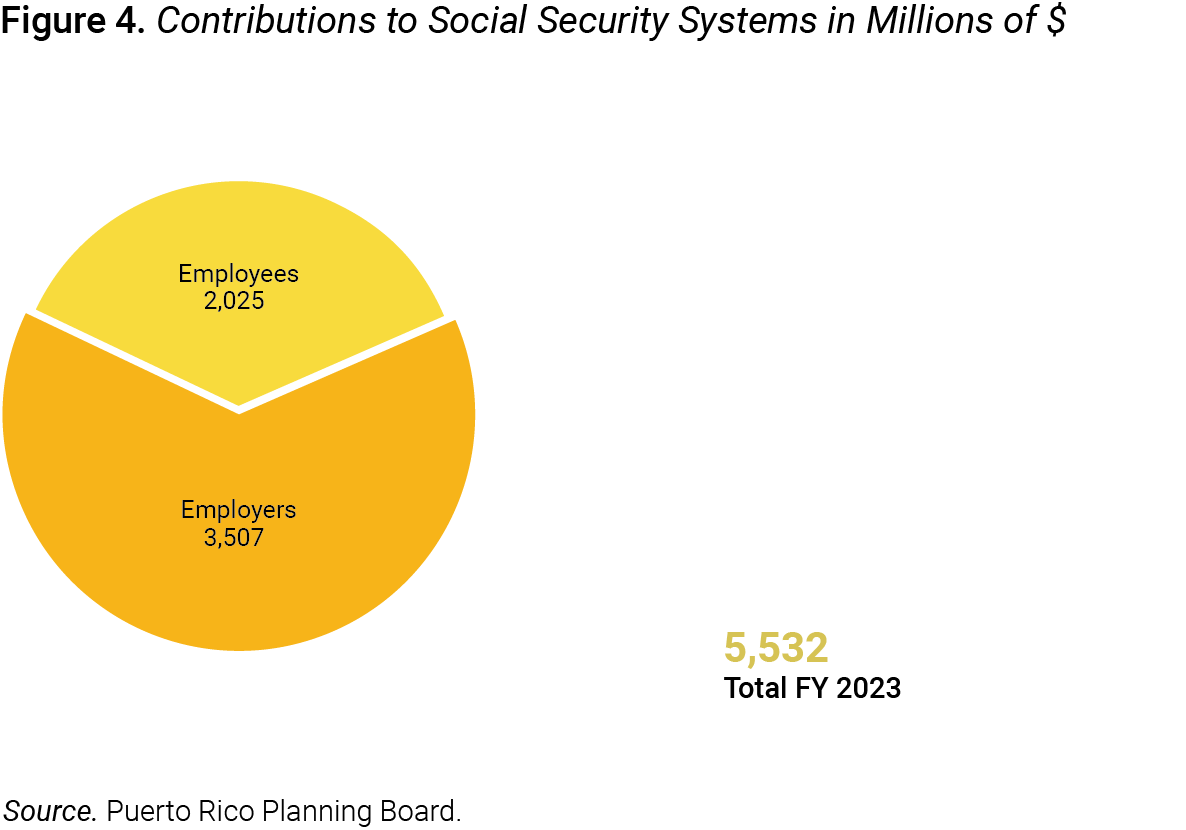
Payments to social insurance and welfare systems do not flow into individuals’ personal income. The total Social Security contributions amounted to $5,532 million (JP, 2023); of this amount, employees contributed $2,025 million and employers contributed $3,507 million, as shown in Figure 4. The total contributions include payments to both the federal and the Puerto Rico governments; for example, total federal Social Security payments from employees and employers amounted to $3,674 million, representing 66.4% of total contributions. Of that amount, employees contributed $1,606 million (JP, 2024) and employers contributed $2,068 million.
3.8. Taxes on Licenses
There are various types of licenses—such as environmental, commercial, operational, recreational, and utility—that may be considered taxes depending on their purpose and the context in which they are charged. For example, the motor vehicle license—known as the marbete—is considered a tax because it is mandatory and there is no direct consideration from the Government in return. It is also classified as a tax because it is charged as a condition for using a good, without a direct relationship to the costs of the service provided. Other examples of licenses considered taxes include those required to sell automobiles, alcoholic beverages, or medical cannabis.
The Government’s total revenue from taxes on licenses was $175 million (JP, 2023), of which $108 million, or 61.7%, came from motor vehicles. The remaining $67 million were classified as “other licenses.” This group includes occupational and professional licenses that function as work permits and require the payment of fees (Carrión-Tavárez et al., 2024), along with other types of licenses. Specific information on which of these other licenses meet OECD criteria for being considered taxes was not identified; nevertheless, since these are government revenues, they were included in this document as part of tax revenues.
3.9. Other Taxes
This category includes specific taxes on transactions. In Puerto Rico, internal revenue stamps—known as “stamps and vouchers”—are mandatory payments for certain documents to have legal validity. They are used, for example, in public deeds (sales and mortgages), judicial certifications, filings with the Department of State, and documentation submitted to government agencies. These specific transaction taxes are classified under the category “Registro y Certificación de Documentos” (Document Registration and Certification) in net General Fund revenues. Total taxes under this concept in 2023 were $123 million.
Also included here are other municipal taxes identified in the Oficina de Gerencia y Presupuesto (Office of Management and Budget) data. These include the Special Additional Contribution for Solid Waste Facilities and the Charge to Telecommunications Companies, Cable TV, and Private Utilities. Collections from these taxes totaled $7 million, for a combined total of $130 million in “other taxes.” “Some taxes are more visible, or salient, than others. … Hidden taxes, like hidden fees, operate under the radar of at least some of those affected” (Burman & Slemrod, 2020, p. 8); this can occur with special taxes approved at the municipal level in Puerto Rico.
The Código Municipal de Puerto Rico (2020/2025) authorizes each municipality to establish taxes or special charges through municipal ordinances.[27] The revenues generated from these sources are not included in this report, as they are not aggregated, identified, or recognized in a general database. Collections from such taxes or charges—created by municipal legislatures—were not found in publications or in data from CRIM or other government entities. Consequently, to determine which taxes or charges exist, their rates, and the amounts collected, it would be necessary to research each of the 78 municipalities individually.
This category could also include other implicit taxes, such as the 911 Service charge and the Puerto Rico Universal Service Fund charge,[28] both billed directly to customers on their monthly telephone service statements. The latter is a federal tax paid in Puerto Rico that has also been replicated at the state level; therefore, telephone subscribers on the Island pay both the Federal Universal Service Fund and Puerto Rico’s own. It was not possible to obtain from the Negociado de Telecomunicaciones de Puerto Rico (Puerto Rico Telecommunications Bureau) the amount of collections associated with these charges. The lack of transparency[29] related to these and other taxes is addressed in section “4.7. Total Federal Taxes in Puerto Rico.”
3.10. Preferential Taxes on the External Sector
The provision of a specific good or service often depends on the incentives a society has to ensure its availability (Dieterle, 2020). Societies have various tax policy tools to stimulate domestic investment and foreign direct investment (FDI). Puerto Rico’s industrialization strategy was designed in the late 1940s with a focus on promoting FDI and creating jobs in manufacturing activities with export potential; consequently, Puerto Rico has a long history and track record of granting tax incentives such as credits, income exemptions, and reduced tax rates to FDI (Catalá Oliveras, 2013).
The effectiveness of tax incentives in attracting FDI remains one of the unsettled concepts in public finance and tax policy literature. Most of the theoretical and empirical studies reviewed conclude that, while tax incentives can be relevant, they are more effective when combined with non-tax factors such as macroeconomic conditions, infrastructure, and institutional strength (Munongo et al., 2017). This study does not aim to describe the incentive schemes and preferential treatments of Puerto Rico’s tax system nor to evaluate their effectiveness;[30] however, it recognizes the importance of tax revenues generated by businesses benefiting from such treatments.
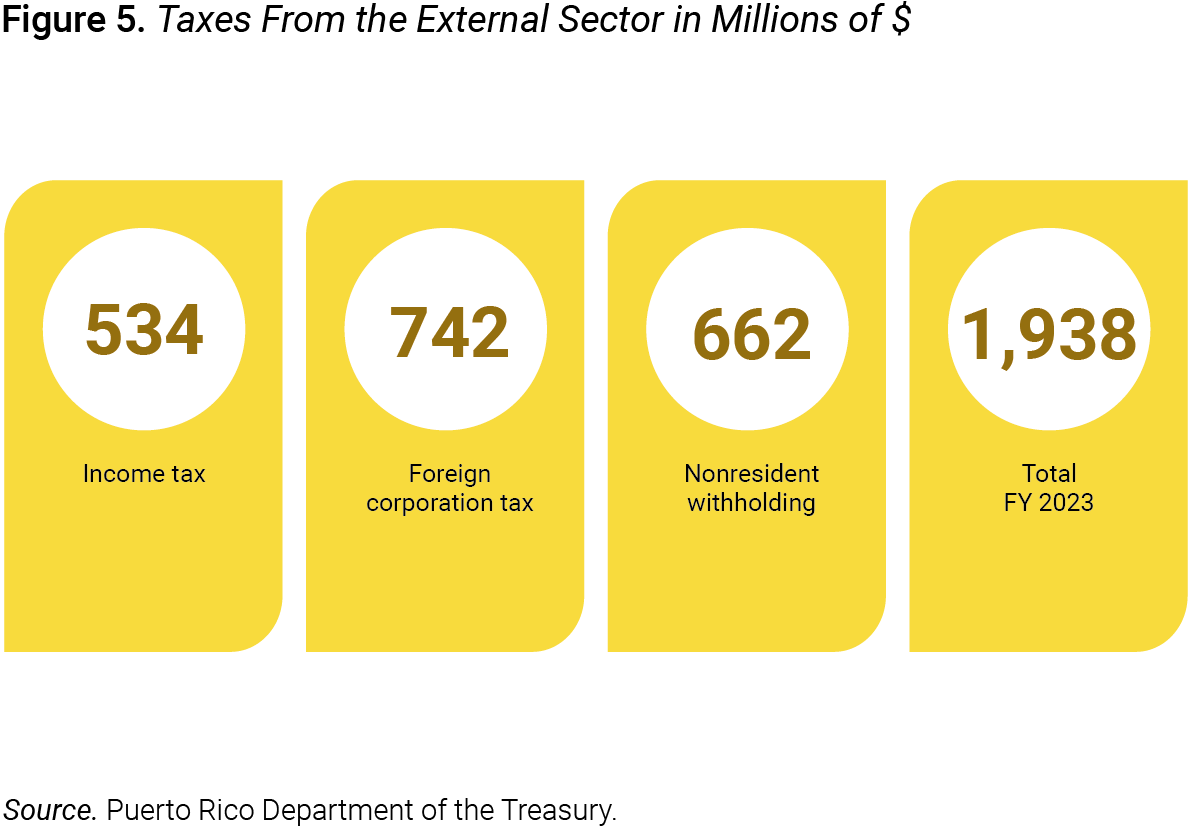
A concentrated group of export-oriented multinational manufacturing companies that are part of a controlled foreign corporation paid $1,938 million in 2023. Section 957 of the Internal Revenue Code defines a “controlled foreign corporation” as any foreign corporation if more than 50% of (a) the total combined voting power of all classes of stock of such corporation entitled to vote, or (b) the total value of the stock of such corporation, is owned (directly, indirectly, or constructively) by United States shareholders on any day during the taxable year of such foreign corporation (Controlled foreign corporations; United States persons, [1999]).
The amount paid by nonresidents or the external sector of the Puerto Rican economy represented 14.5% of total net General Fund revenues. Revenues are distributed among three types of preferential taxes: the industrial development income tax; the excise tax on the acquisition of certain tangible personal property and services (Ley para Establecer un Impuesto a las Corporaciones Foráneas, 2010/2021); and the royalty tax for the use of patents in manufacturing (Cao García, 2004), known as withholding on nonresidents. Figure 5 shows the distribution of tax revenues from the external sector, broken down by type of tax.
The composition of external sector taxes will change in the coming years as a result of the new provisions of Ley Núm. 52 de 2022, which essentially replaces the excise tax on foreign companies with an income tax. It is important to note that “preferential taxation could overburden the tax system, which ideally should provide for the application of simple, fair, and efficient taxes. Tax incentives risk undermining the basic principles of taxation to the extent that they complicate the tax system, create horizontal inequality and distort the efficiency of production” (Rudenko et al., 2023, p. 69).[31]
4. Federal Taxes in Puerto Rico
“Taxation without representation is tyranny” is one of the political slogans used by American colonists living under British rule and government.[32] This outcry encapsulates the belief that it is unjust to pay taxes to the government of a country of which the taxed individuals are not a part[33] and in which they have no full representation. As Habiger (2023) states, “[a]fter the American colonies broke away from Britain, taxation without representation still existed. Puerto Ricans, for instance, are citizens of the United States, but they are unable to cast ballots in presidential elections, and have no voting representatives in Congress.” Puerto Ricans also pay taxes to the United States Government.
Residents of Puerto Rico certainly contribute billions of dollars every year to the U.S. Department of the Treasury, contrary to the erroneous and widespread notion that Puerto Ricans do not pay federal taxes. This federal taxation is a verifiable fact through publicly available IRS information (Vargas-Ramos et al., 2024). Below are several federal taxes paid in Puerto Rico, some of which are taken into account to determine the total taxes paid on the Island, calculate the tax burden of its residents, and compare elements of its tax structure with that of the 50 states.
4.1. Income Taxes
Federal income taxation in Puerto Rico dates back to the early period of U.S. colonial rule, when “a ‘territorial’ tax based on the net income of property … essentially functioned as an income tax on agricultural operations in Puerto Rico at a time in history when the federal government did not even have a comprehensive individual or corporate income tax” (Dick, 2015, p. 22).[34] Currently, Puerto Rico has partial fiscal autonomy with respect to income generated in the territory, allowing such income to be subject solely to Puerto Rico’s tax system and not to the U.S. federal tax system (Internal Revenue Code [IRC], 1954/2023).[35]
There are exceptions, in specific circumstances relevant to this study, in which the federal income tax applies to individuals.[36] These exceptions are: (a) persons with income from sources outside Puerto Rico (for example, investments or remote work for U.S. companies); (b) employees of the federal government, including members of the U.S. armed forces stationed in Puerto Rico—a total of 19,500 people in 2023 (Planning Board, 2024); (c) U.S. citizens with dual residency or who remain in Puerto Rico for fewer than 183 days per year; and (d) eligible persons claiming certain refundable federal credits, such as the Child Tax Credit.
4.2. Payroll Taxes
The federal exemption from income tax in Puerto Rico does not extend to federal payroll taxes, corresponding to contributions to Social Security and the Medicare health program. Federal payroll taxes are often referred to by the acronyms of the laws authorizing them, for example, FICA (Federal Insurance Contributions Act) and SECA (Self-Employment Contributions Act), and they apply to all workers earning wages or compensation for personal services according to their employment status, regardless of whether they reside in one of the 50 states or in a territory such as Puerto Rico.[37] The rates for these taxes are the same in Puerto Rico and in the 50 states.
The Social Security tax rate is 6.2% for the employer and 6.2% for the employee on all earnings, amounting to a total of 12.4%, up to a maximum limit of $160,200 (in 2023). “The cap is adjusted every year for increases in average wages. Because of the cap, the Social Security tax is much smaller share of earnings at the top than for low- and middle-income earners” (Burman & Slemrod, p. 60). The Medicare tax rate is 1.45% for the employer and 1.45% for the employee on all earnings, that is, a total of 2.9%, with no maximum limit. Self-employed workers pay both components (IRS, 2024), at a combined rate of 15.3%.
4.3. Estate Taxes
The tax treatment applicable to a person who is a U.S. citizen, resides in Puerto Rico or another U.S. possession, and owns assets within the 50 states at the time of death is particular and noteworthy. The federal Internal Revenue Code provides that such an individual will be considered a “nonresident not a citizen of the United States” if they acquired U.S. citizenship solely by reason of: (1) being a citizen of such possession or (2) having been born or residing there (IRC, 1960). Under this provision, the assets that person owns within the 50 states will be subject to the federal estate tax.
The estate of persons born in Puerto Rico or anywhere in the United States who are domiciled on the Island at the time of death will be subject to the payment of federal estate taxes on assets they own within the 50 states, in excess of $60,000 (IRS, 2025b). This means that if the value of assets located in the United States—excluding its possessions—at the time of death exceeds this threshold, the executor or heirs must file the federal Form 706-NA, United States Estate (and Generation-Skipping Transfer) Tax Return Estate of Nonresident Not a Citizen of the United States (IRS, 2019), corresponding to the decedent’s estate.
In contrast to the $60,000 exclusion applicable to U.S. citizens born and domiciled in Puerto Rico, the estate of those residing in one of the 50 states at the time of death is entitled to an exclusion of $13,990,000 at present, an amount that increases annually in proportion to inflation. The tax situation of persons born in Puerto Rico but domiciled outside Puerto Rico and the United States at the time of death will be the same as that of any person born in one of the 50 states. This means they must declare all their assets on the corresponding federal return, claim the credit for taxes paid to other countries, and take the $13,990,000 exclusion.
4.4. Customs Duties
Puerto Rico is part of the U.S. customs system, as established in the United States Code (Duties and taxes to constitute fund for benefit of Puerto Rico; ports of entry, 2023). This integration means that Island residents are subject to federal customs duties on goods imported from foreign countries; consequently, the price of imported goods consumed by Puerto Rico residents includes in its cost the corresponding federal customs tax. Under current federal law, the revenues generated from customs duties in Puerto Rico, after deducting administrative costs, must be transferred to the Treasury of Puerto Rico.[38]
For the purposes of this report, the point of interest is the total amount of customs duties paid by Puerto Rico residents in connection with imports. In Fiscal Year 2020, U.S. Customs and Border Protection (CBP, 2021) reported that CBP San Juan Field Operations “supported federal government services and promoted a competitive global marketplace for American businesses by collecting $237 million in duties, taxes, and other fees.” It is estimated that customs duty revenues amounted to $250 million during calendar year 2023, in accordance with data from the U.S. International Trade Commission (Stewart, 2024).[39]
4.5. Telecommunications Taxes (Universal Service Fund)
The Federal Universal Service Fund is a type of redistributive tax, established “to support vital communications investments where the marketplace falls short” (Office of the Chairwoman, 2024). Its purpose is to provide telephone and internet services to “low-income consumers and those in rural, insular, and high-cost areas” (Telecommunications Act of 1996, 1996). The law requires telecommunications companies to contribute a portion of their revenues to the Federal Universal Service Fund;[40] however, these companies pass this responsibility on to their customers, who ultimately pay this tax through their monthly bills.
The companies remit the money to the government and may subsequently be eligible to receive funding to expand, provide, and promote their services to customers under universal service parameters. The Federal Communications Commission does not publish collections from this tax broken down by state; however, it reported that in 2023, carriers on the Island received $76 million to connect households in the most rural communities; from 2022 to 2024 they received $95 million for broadband connectivity and internal connections for schools and libraries; and in March 2024, 551,253 local subscribers received discounted phone and/or internet service (Office of the Chairwoman, 2024).
4.6. Taxes on Air Transportation
Residents of Puerto Rico pay federal taxes on air transportation in the same way as residents of the 50 states. The taxes included in the total cost of airline tickets apply uniformly to all domestic flights in the United States, including those connecting Puerto Rico with the states or other U.S. territories. Puerto Rico is part of the federal civil aviation system; therefore, flights between the Island and the rest of the United States are considered domestic, not international. This system includes the Department of Transportation, the Federal Aviation Administration, and the Transportation Security Administration.
The structure and rates of the air transportation tax include: (a) a 7.5% tax on the amount paid for air passenger transportation; (b) $5.00 per passenger per domestic segment; (c) an international facilities use tax of $22.20 per passenger, applicable to international flights beginning or ending in the United States; and (d) a reduced rate of $11.10 per passenger for flights from Hawaii or Alaska (Internal Revenue Code, 2023c).[41] Taxes collected on airline tickets go to the Airport and Airway Trust Fund. It was not possible to identify a record of the amount of federal taxes on airline tickets paid by residents of Puerto Rico.
The Puerto Rico Planning Board produces and publishes statistics on the number of trips and travel expenses of Puerto Rico residents. Using that information, an estimate was made of the total air transportation tax paid on the Island. The result of this exercise was about $30 million in 2023. This amount was not included in the total taxes paid because it did not come from an official source and has a marginal effect on the calculation of the tax burden and comparative analysis. It would be beneficial to know the actual amount collected from airline ticket taxes to integrate it into the total contributions paid by Puerto Rico residents.
4.7. Total Federal Taxes in Puerto Rico
Total gross federal collections from Puerto Rico in 2023 amounted to $5,390 million (IRS, 2025c). This amount is composed of various taxes such as income tax, payroll tax—which is the main source—, estate tax, and excise taxes. IRS figures include the payroll tax portion within the income tax category. To separate the amount corresponding to contributions to the federal social security systems, statistics published by the Puerto Rico Planning Board were used. The total contributions to the federal social security systems amount to $3,674 million; this means that, of the $5,390 million, $1,716 million corresponds to other tax categories.
One of the greatest difficulties encountered during the study was the lack of transparency regarding federal tax processes on the Island. Public entities and government officials in Puerto Rico tend to be reserved when it comes to disclosing information related to the amounts of federal taxes paid by residents. They are also not open to informing the public about the administrative costs that the federal government deducts from collections made on the Island. Although this information is presumed to be public, efforts to obtain it were unsuccessful. This opacity prevented an accurate calculation of the amount of federal taxes collected in Puerto Rico.
Several federal agencies also do not publish some of their collections from tariffs, fees, and taxes, or do not break them down by state or jurisdiction; this also limited the research. Examples include customs duties, the coffee import tariff, telecommunications taxes (Universal Service Fund), and air transportation taxes. Officials from state and federal entities in Puerto Rico and the United States responded to information requests with instructions on how to submit them—such as completing online forms or sending written petitions—; however, even after following such procedures, the requested information was not provided.
5. Total Taxes Paid
The total federal, state, and local taxes paid in Puerto Rico by both resident and non-resident individuals and businesses amounted to $23,281 million in fiscal year 2023. The main tax category was the income tax, with $7,424 million, followed by social security contributions, which totaled $5,532 million. Adding to these two categories the real and personal property taxes ($1,172 million) and federal taxes ($1,716 million) yields the total for direct taxes—those levied on the income or wealth of individuals and businesses. This total amounts to $15,844 million, equivalent to 68.1% of total collections.
Indirect taxes, as noted earlier, are those paid on consumption. These include the categories of taxes on goods and services, taxes on goods (excise taxes) and certain transactions, and other taxes. Together, these categories represent $7,437 million, equivalent to 31.9% of tax revenues. The residual categories—those with a share below 1%—have a marginal weight in the tax structure. This distribution reveals a marked dependence of the tax system on direct taxes, which reinforces its progressive nature and makes it vulnerable to the concentration of the burden on specific segments of the population. Table 6 details this composition.
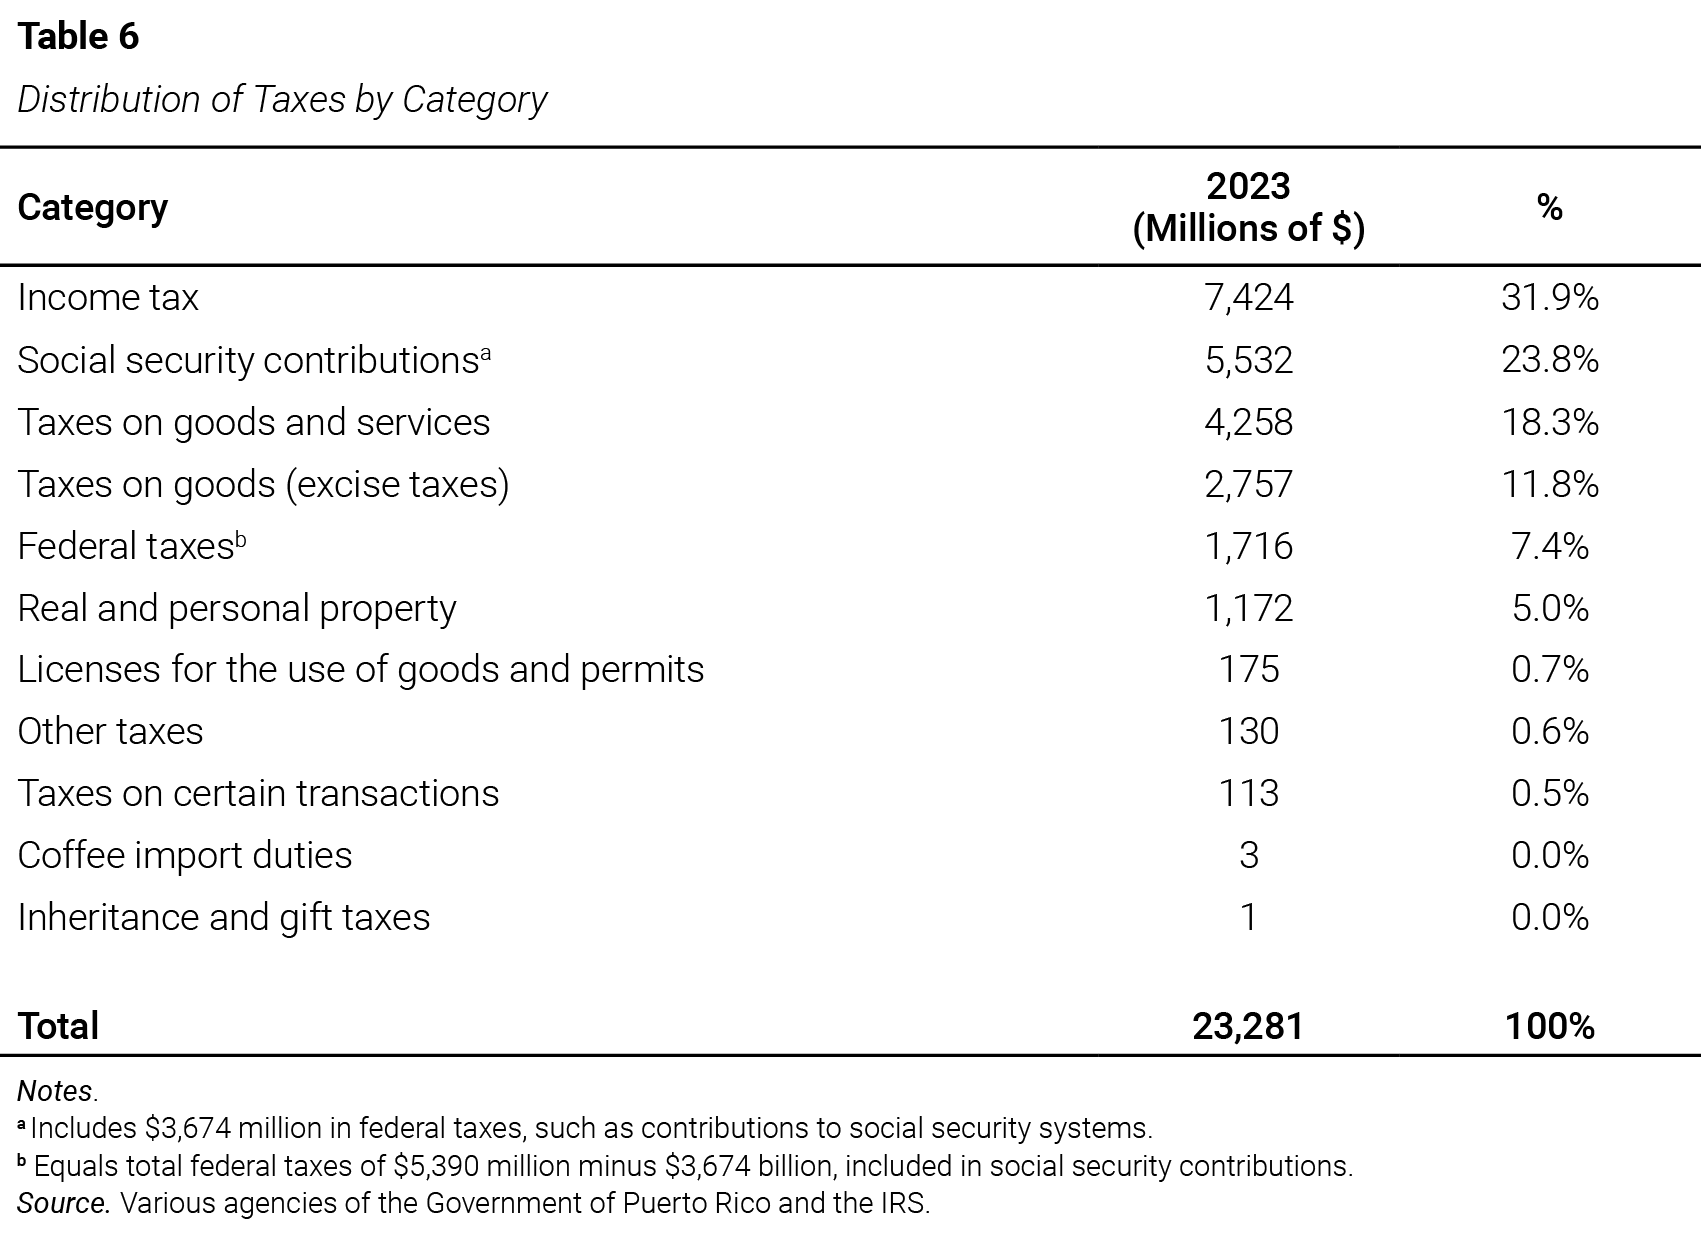
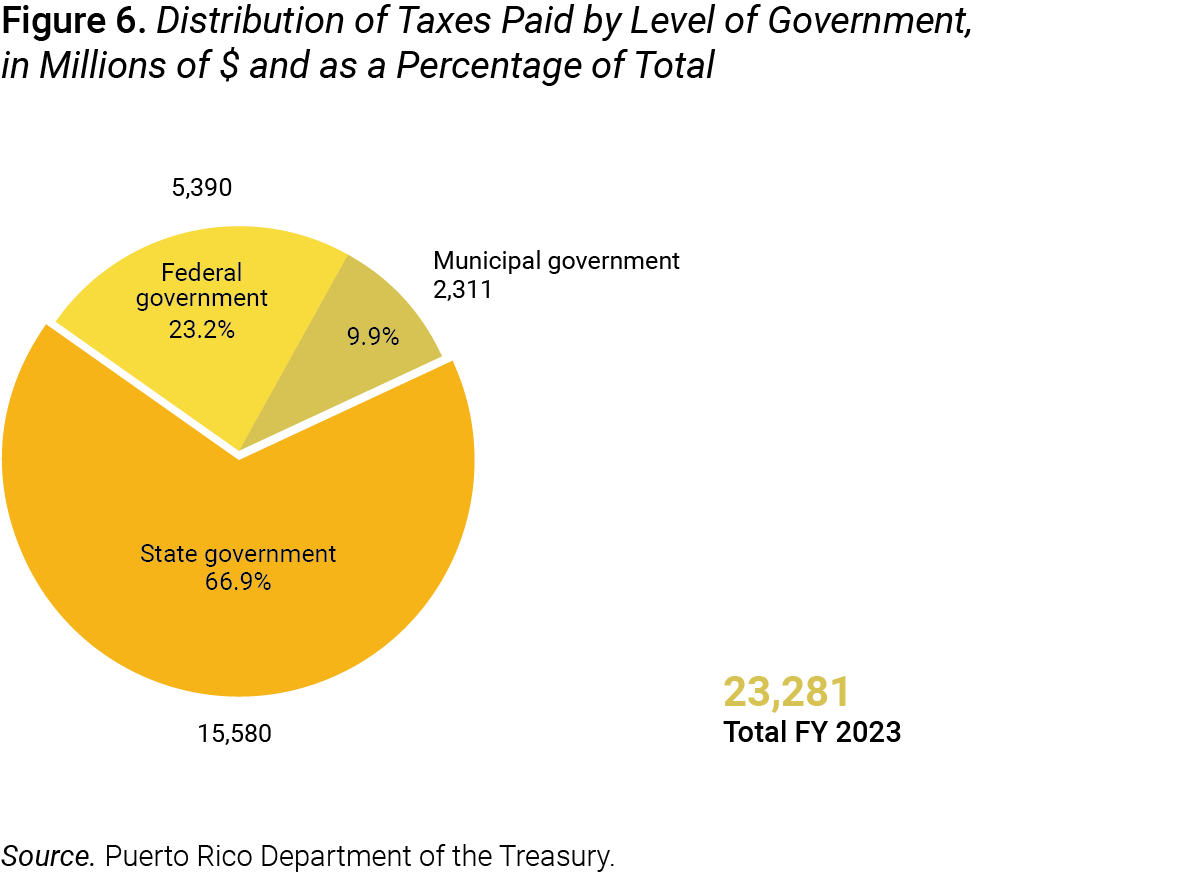
Figure 6 illustrates the distribution of taxes collected at the three levels of government. This breakdown makes it possible to assess how different taxes affect the flow of fiscal revenues and economic activity. It is noteworthy that in Puerto Rico, more taxes are paid to the federal government than to the local (municipal) government, and that the latter—the level closest to the people—accounts for only 9.9% of total collections. For every dollar residents pay in taxes to the municipal government, they pay approximately $6.74 to the state government and $2.33 to the federal government. This distribution reflects a markedly centralized public administration and tax structure.
A worker pays taxes on their salary and then sees their disposable income subject to multiple indirect taxes related to the consumption of goods and services. It is common for a single item to be taxed multiple times, almost always twice, depending on the type of product and the nature of the transaction (such as import or sale).[42] In Puerto Rico, several items are subject to more than one tax at different stages; for example, gasoline is subject to the gasoline excise tax as well as the excise tax on crude oil, derivative products, and other hydrocarbon mixtures. Other examples are beer and wine, which are subject to the producer’s excise tax and, when purchased by the consumer in a store, also pay the SUT.
The case of a coffee with sugar prepared in an establishment is particularly illustrative, as it may involve the payment of up to four taxes. If the coffee is imported, it is subject to the coffee import tariff; if it contains sugar, it is also subject to the sugar excise tax; if it is ready for consumption, the 7% SUT on prepared foods applies; and, when purchased in a business, the municipal license tax (patente) is added.[43] These examples show how the total taxes paid have a considerable impact on people’s daily lives. The effect of taxes on people’s pockets can be better understood when quantified and expressed in monetary terms through the tax burden on residents and the per capita tax.
6. Puerto Rico’s Tax Burden
The tax burden of a jurisdiction is defined as the percentage ratio between the total taxes paid by residents and their total income. From a macroeconomic perspective, it corresponds to the relationship between total tax revenues and the monetary value of the goods and services produced within a country’s economy. There are two principal economic indicators used to measure a country’s production: Gross Domestic Product (GDP) and Gross National Product (GNP). Both indicators can be employed to calculate the tax burden, and the relevance of each depends on the specific characteristics of the country’s economy.
GDP is the total monetary value of all final goods and services produced within a country by individuals and companies, both domestic and foreign, during a given period (Gómez-Barroso, 2022). In other words, GDP reflects the value of production generated by domestic or foreign entities, whether resident or nonresident. In contrast, GNP represents the monetary value of all final goods and services produced in a year by residents and local companies, regardless of whether the production takes place inside or outside the country. Due to the importance of foreign investment in Puerto Rico’s manufacturing sector, GDP is significantly higher than GNP, unlike in most countries.
Puerto Rico’s GDP in 2023 was $117,903 million, while GNP was $81,550.7 million—a percentage variation of 44.6%. This gap is mainly due to the significant participation of foreign companies in Puerto Rico’s productive structure, particularly in the pharmaceutical and medical device industries. Under accounting methodology, the value added by these companies is included in GDP, as it is reflected as production within the territory. Since most of the profits generated return to the country of origin of the FDI,[44] those revenues are not counted in GNP, which is based on income generated by factors of production owned by residents.
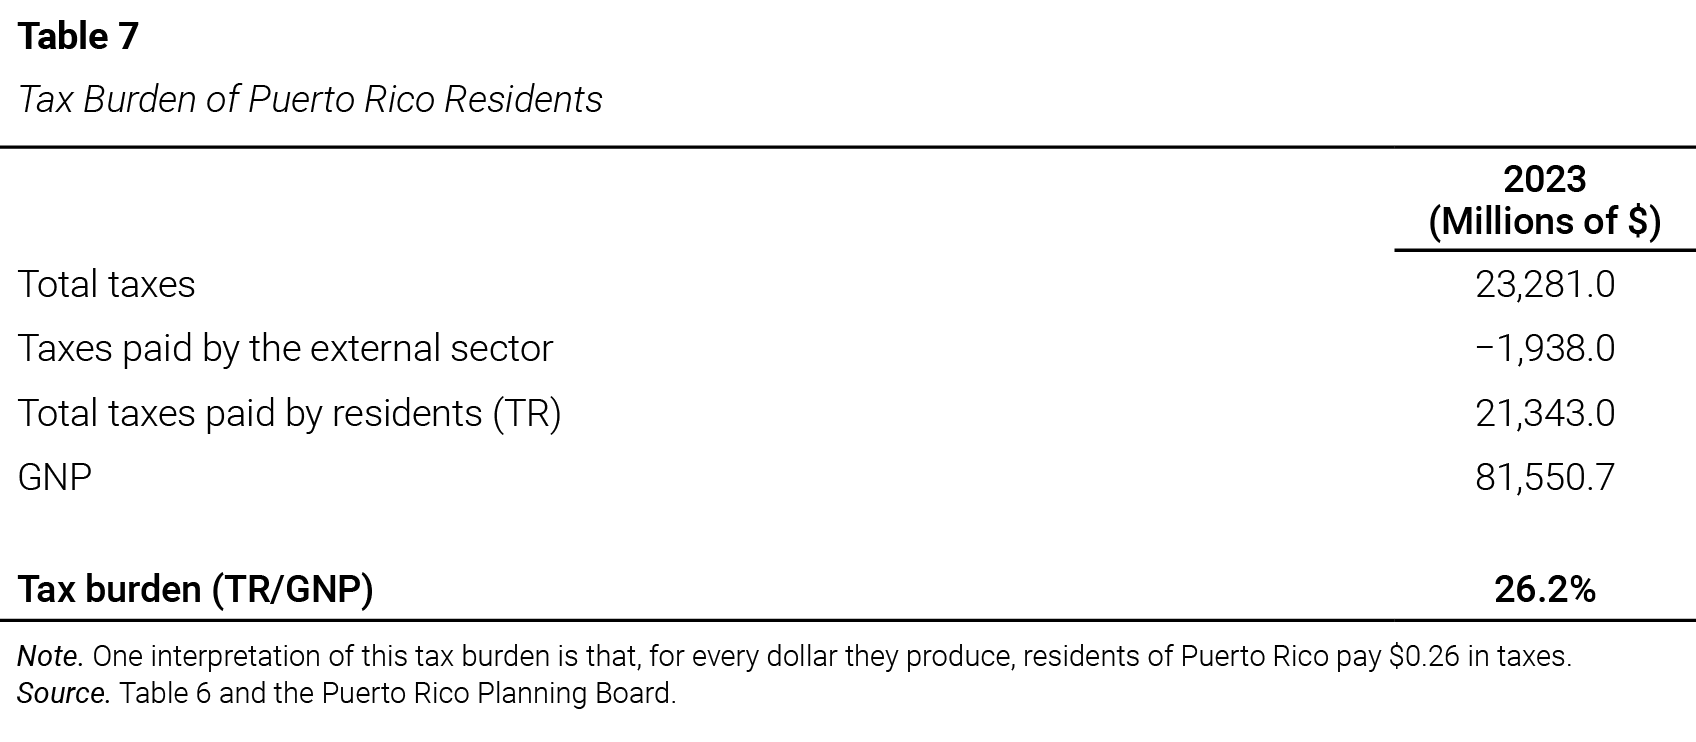
The profits of foreign companies receive preferential tax treatment and correspond to taxes paid by nonresidents or the external sector. The inclusion or exclusion of these taxes in calculating Puerto Rico’s tax burden has a significant impact. The total taxes paid in Puerto Rico in fiscal year 2023 amounted to $23,281 million; of that amount, Puerto Rico residents paid $21,343 million and the external sector paid $1,938 million. Dividing total taxes paid ($23,281 million) by GDP ($117,903 million) yields a tax burden in Puerto Rico of 19.7%. If only the taxes paid by residents ($21,343 million) are divided by GNP ($81,550.7 million), the tax burden in Puerto Rico is 26.2%.
Internationally, tax burden is measured as the ratio of tax revenues to GDP; for this reason, in order to make international comparisons, Puerto Rico’s GDP must be used. To calculate the tax burden of residents, it is appropriate to exclude taxes paid by the external sector and use GNP.[45] In summary, when this report presents the tax burden based on GDP, it includes taxes paid by both residents and the external sector; but when referring to the tax burden of Puerto Rico’s residents, taxes from the external sector are excluded and GNP is used. Table 7 details the calculation of the residents’ tax burden.
The elements of Puerto Rico’s tax system are dispersed across codes, laws (and their numerous amendments), rules, regulations, as well as specific ordinances of the 78 municipalities. This dispersion makes Puerto Rico’s tax system fragmented, intricate, and difficult to organize as a whole. Furthermore, the ambiguity and imprecision—both linguistic and numerical—present in some of these elements[46] add complexity to the tax system and pose a challenge for the accurate identification of sources and the precise accounting of the total amount of collections. If all amounts paid in undetected taxes or fees were known with certainty, the tax burden on residents would be higher.
7. Puerto Rico’s Per Capita Tax
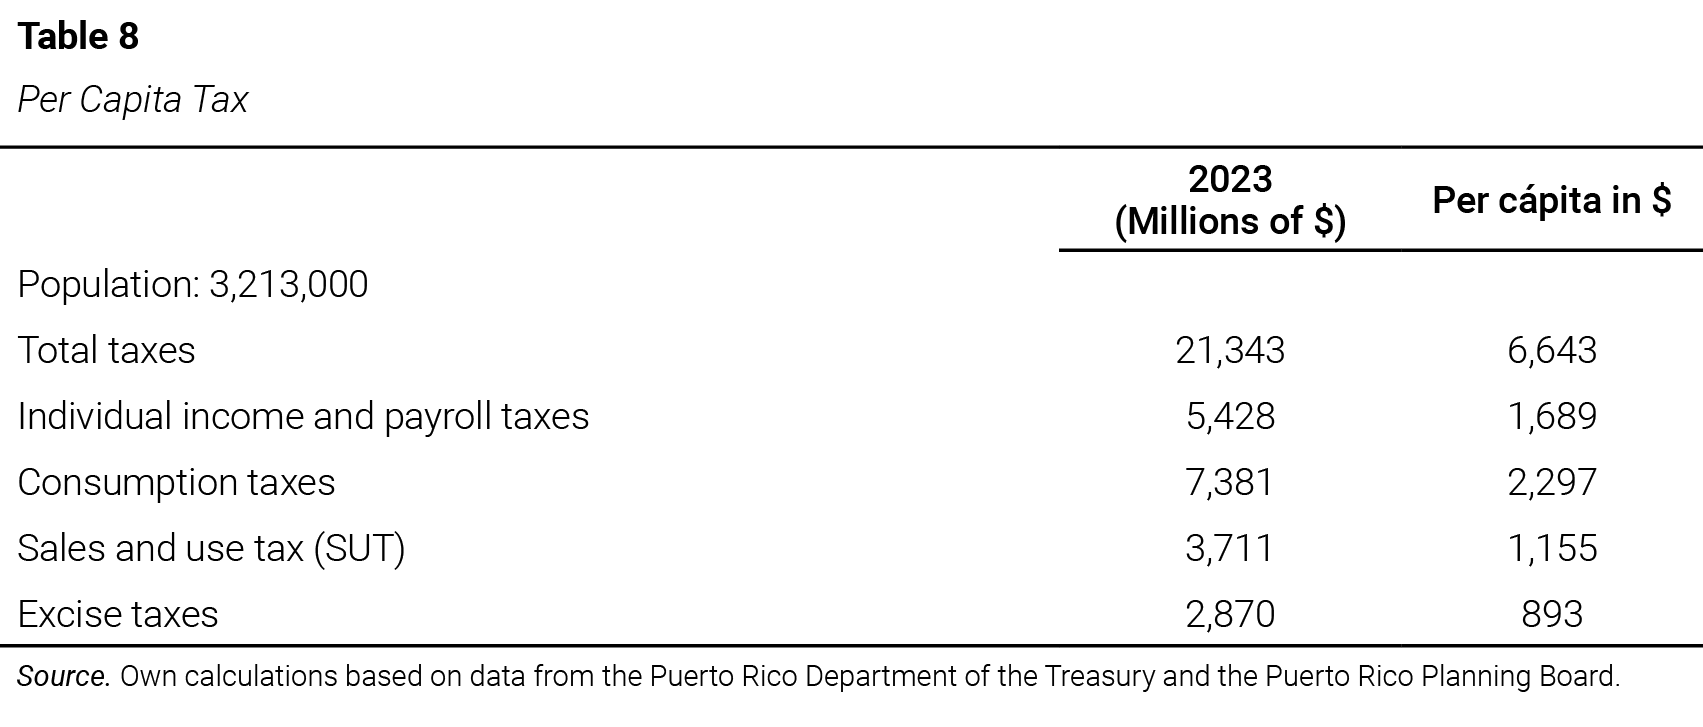
Another statistical indicator used to measure the weight of taxes is per capita taxation. This refers to the average amount of taxes each person pays in a year; in other words, it measures the average tax effort per person. “It is important to recognize that higher per capita tax collections are the result of a complex web of interconnected choices, priorities, and variables—tax rates, tax bases, and the economy on which they’re imposed” (Johns, 2025); and it can have implications for a society’s tax compliance. The per capita tax is a microeconomic and distributive approach, calculated by dividing the total collected by the total population.
In 2023, Puerto Rico residents paid $21,343 million in taxes, and the population was 3,213,000 people. This amounts to an average of $6,643 per capita, or $554 per month. It is also possible to calculate per capita tax contributions for specific taxes, which can offer a more accurate representation of the fiscal effect on individuals (Table 8); for example, per capita consumption taxes (including the sales and use tax), all excise taxes, the municipal license tax, and customs duties average $2,297 per person. For individual income tax, including payroll taxes, the average is $1,689 per person.
The tax burden and per capita tax are useful indicators for analyzing people’s economic situation and the possible effect of the tax environment on compliance. Studies have found a statistical correlation and significant effect between the level of tax rates and taxpayers’ willingness to voluntarily comply with their fiscal obligations (Chindengwike, 2022, p. 893). Experience shows that when the tax rate decreases, the level of taxpayer compliance increases, while higher tax rates are associated with lower compliance levels (Benedicto, 2016; Masud & Gambo, 2019).[47]
8. Comparison of State and Local Taxation in Puerto Rico and the 50 States
In the United States, taxes are paid at the federal, state, and local levels.[48] A resident of any state is subject to paying these taxes, whose differences—aside from the political and jurisdictional scope—lie in the destination of the collected funds. The federal tax system is uniform, meaning it applies a single set of tax rules throughout the country with no state-by-state variations; however, each state has autonomy to establish its own tax systems. States therefore design their tax policies—for example, deciding whether to levy a personal income tax, defining the taxable base for consumption tax, and setting their credits and deductions.
The significant differences between state tax systems have demographic, economic, business, labor, and productive implications. When businesses and workers are mobile across state borders, these differences “over time and place have the potential to significantly affect the geographical allocation of highly skilled workers and employers. … Many states aggressively and openly compete for firms and high-skilled workers by offering low taxes. Indeed, low-tax states routinely advertise their favorable tax environments with the explicit goal of attracting workers and business activity to their jurisdiction” (Moretti & Wilson, 2017, p. 1).[49]
Since states compete with each other to attract investment, workers, and retirees, comparing their state and local tax structures is essential for fiscal policy formulation. This comparison is also useful for businesses and individuals in deciding where to invest or settle. Federal taxes, applying equally to each state, are therefore not considered in the comparisons and rankings among the 50 states based on taxes paid and tax burden. The following section presents a comparison of the tax structures of Puerto Rico and the 50 states, using state and local revenue sources as the reference point, with federal taxes excluded.
8.1. Comparison of Tax Burden
As explained earlier, the tax burden is an indicator of the weight of taxes on economic activity. The tax burden of Puerto Rico’s residents was calculated using two references: GDP and GNP. In 2023, Puerto Rico’s GDP exceeded its GNP by 44.6%, a percentage variation substantially greater than that recorded in the United States, where it was just 0.6% in 2022. This marked divergence is one of the most distinctive structural features of Puerto Rico’s economy. The gap reflects the disproportionate weight of the productive activities of foreign companies in the local economy, whose revenues are not fully integrated into the Island’s national income.
GDP replaced GNP as the main measure of U.S. production in the 1990s (United States Department of Commerce, 1991).[50] GNP continues to be a key aggregate in the national income and product accounts, but the state-level breakdown stopped being published. For the comparative analysis of Puerto Rico’s tax burden with that of the United States overall and each of the 50 states, GDP is used because it is the internationally accepted measure and is available by state. In addition, the tax burden of Puerto Rico’s residents based on GNP is included, as it is considered to provide a more accurate representation of their fiscal situation.
To compare Puerto Rico and the United States using GDP or GNP, it is necessary to establish homogeneous comparative bases to ensure consistency and validity of the analysis. The statistics for state and local taxes in the 50 states exclude taxes paid by the external sector, state contributions to Social Security, and federal taxes. Similarly, in comparisons of federal, state, and local taxes, payments from the external sector and state contributions to Social Security are also excluded; therefore, it is necessary to exclude these contributions from the total taxes paid in Puerto Rico for a valid comparison with the United States.
The first column of Table 9 presents the calculation of the tax burden of Puerto Rico residents (with the exclusions noted in the previous paragraph) for comparisons based exclusively on state and local taxes. The result is an adjusted total of $14,095 million in taxes and a state and local tax burden of 17.3%. The second column of the same table shows the calculation of the tax burden for comparisons that include federal, state, and local taxes. In this case, the adjusted total tax revenues amount to $19,485 million, and the corresponding tax burden is 23.9%.
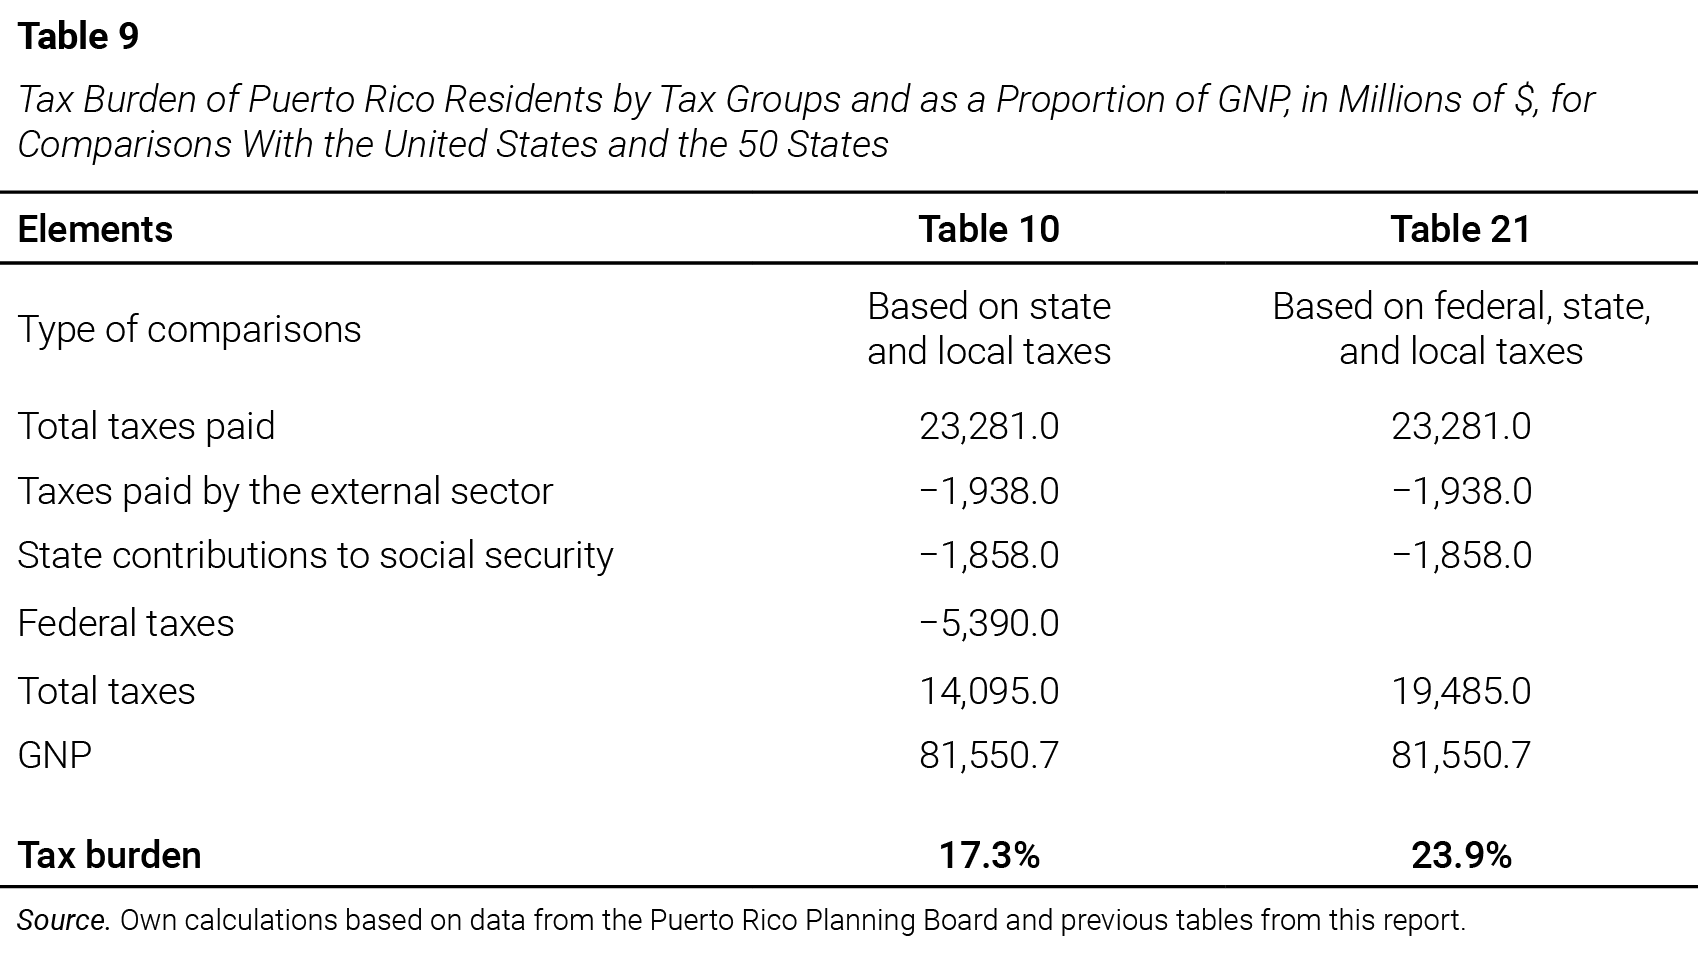
Table 10 presents a comparison of the total state and local tax burden in Puerto Rico, the U.S. average, and the 50 individual states. Puerto Rico’s tax burden—measured by GDP (13.6%) or by GNP (17.3%)—exceeds the U.S. average and is higher than that of every state. This comparison indicates that state and local taxes in Puerto Rico are relatively higher than in the states. Moreover, it shows that each dollar generated by economic activity in Puerto Rico is taxed at $0.17, a substantially higher amount than the U.S. average of $0.09, and at least double that of 22 states.

8.2. Comparison of the Distribution of Taxes by Type
Understanding the structure of the tax system from an economic, social, and political perspective is essential for several reasons; for example, it is the basis for evaluating whether the tax system is adequate, efficient, and fair. There is disagreement about what makes people consider taxes fair or unfair and about “how the burden should be shared across families of different levels of affluence. The current personal income tax is designed to be “progressive,” meaning that higher-income people typically pay a larger percentage of their incomes in taxes than do those with lower incomes” (Slemrod & Bakija, 2017, pp. 9–10).
“For some, a “fair” tax system means maintaining this progressivity and perhaps increasing the burden on those with higher incomes.” Others, however, dismiss this idea on the grounds that it penalizes those who produce the most. “Not surprisingly, people’s views about whether the tax system is fair are strongly influenced by how hard the tax system hits their own families” (Slemrod & Bakija, 2017, p. 10). “It should be mentioned, however, that policies that make the distribution of income more equal are not always fairer” (Brys et al., 2016, p. 5). Some differences in income may be considered fair in the sense that they reflect differences in individual effort (Cappelen & Tungodden, 2012) and productivity.
Table 11 compares the distribution of state and local taxes by type in Puerto Rico and the United States. Puerto Rico has a more concentrated structure, relying 69.6% on two types of taxes: consumption taxes on goods and services and corporate taxes; moreover, the latter is the one that differs the most between both jurisdictions, with a percentage 4.4 times higher on the Island than the U.S. average. The main sources of tax revenue in the United States are three: consumption taxes on goods and services, property tax, and personal income tax, representing a more diversified fiscal structure.
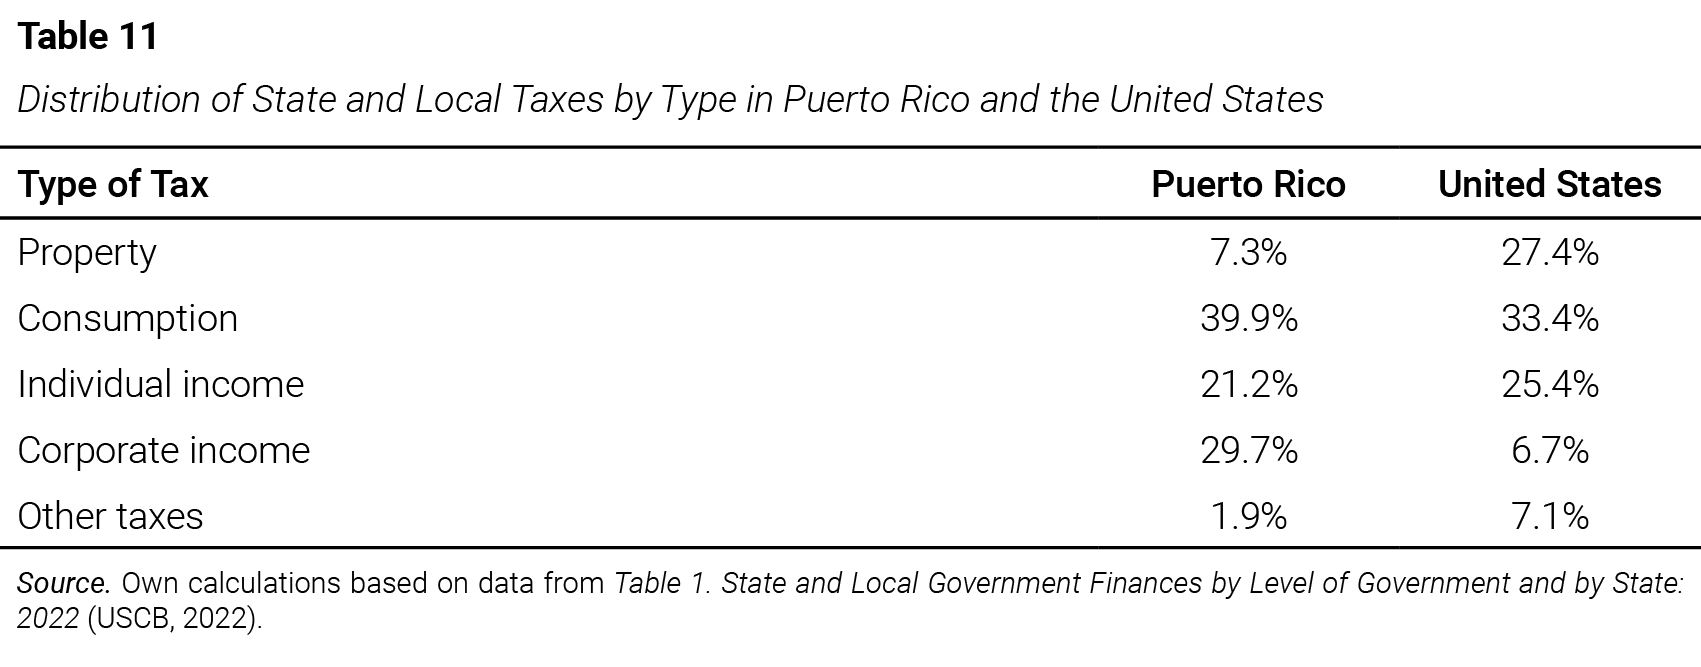
The comparison highlights that Puerto Rico relies much less on property taxes—7.3% versus 27.4% in the United States—. This is a symptom of lower property valuation, less fiscal pressure on real estate, and a less developed legal structure for collecting this type of tax.[51] It is also noteworthy that in both tax systems, personal income tax ranks third in collections, although it is less significant in Puerto Rico (21.2%) than in the United States (25.4%). It is important to remember that these percentages correspond to state and local taxes. Property tax in Puerto Rico merits a specific and in-depth study.
Table 12 shows the notable dissimilarity between revenue sources in each of the 50 states. State and local governments combine various taxes with different rates and tax bases. The scale and scope of taxable economic activity in each state reflect its economic and fiscal policies, tax legislation, and the political preferences of its residents, who can influence the design of the tax system and the balance of government financing. Ultimately, each state designs its tax system in line with its predominant economic model, the availability of resources, and the demand for public services.
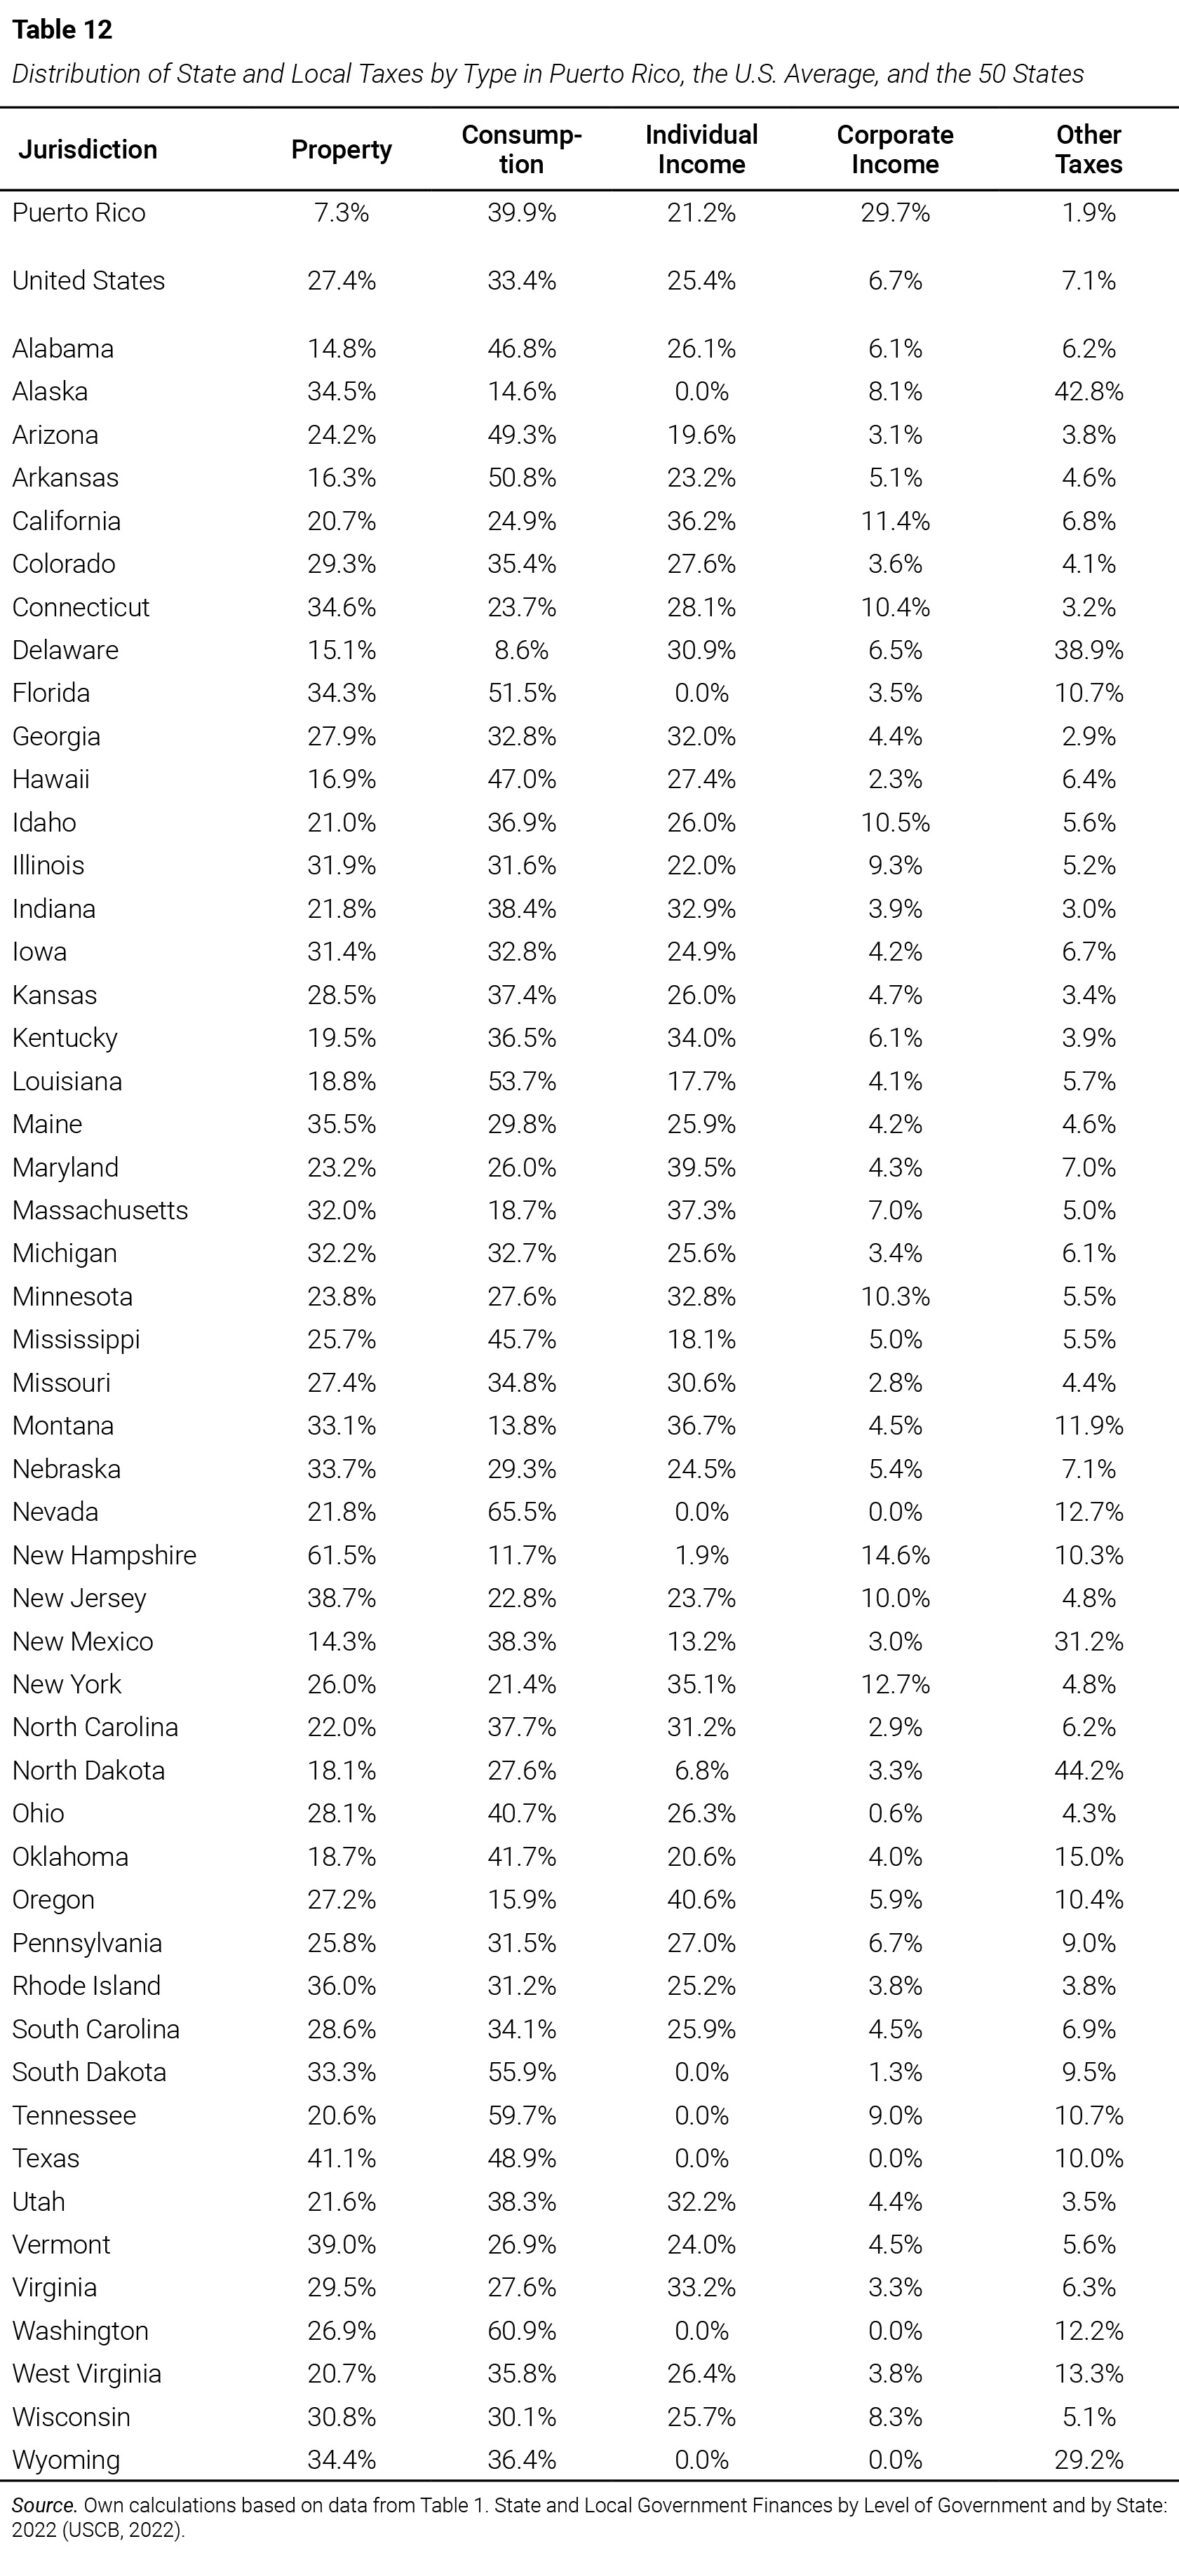
Table 13 highlights the relative importance of each tax category with respect to total tax revenue, which varies widely among the 50 states. This table includes the states with the lowest and highest revenue share by tax type; for example, property tax represents 14.3% of state and local revenues in New Mexico, while in New Hampshire it is 61.5%. These two states also have a substantial difference in personal income tax, which in New Hampshire is 1.9% and in New Mexico is 13.2%. Such differences may reflect not only fiscal decisions but also specific economic realities of each jurisdiction.
Regarding consumption taxes on goods and services, the U.S. average is 33.4%; but in Delaware—where there is no general sales tax—it is 8.6% and in Nevada it is 65.5%. Although Delaware does not apply that tax, it does have excise taxes (for example, on gasoline, alcohol, and tobacco) and a gross receipts tax, categories included in consumption taxes. Nevada, for its part, is among the states with one of the broadest tax bases for sales tax, as it taxes a wide variety of goods and services. This contrasts with other states that apply more exemptions or differentiated rates, depending on the type of product.
Other particular cases are North Dakota and Delaware, where the main revenue source is the “Other taxes” category (with 44.2% and 38.9%, respectively), in contrast to Georgia where it accounts for just 2.9% and is the smallest category. This category includes the severance tax, which applies, for example, in North Dakota. These revenues depend not only on the existence of natural resources but also on their active exploitation and the fiscal framework regulating their taxation. This characteristic provides certain states with an uncommon but fiscally significant source of revenue.

8.3. Comparison of Per Capita Tax
The relationship between the tax burden and per capita tax is close; however, both indicators measure different concepts within economic and fiscal analysis. Although derived from the total tax collected, per capita tax—in addition to depending on the types of taxes and applicable rates—is calculated according to individuals’ income. The economic-tax analysis of per capita tax across jurisdictions aims to compare the absolute magnitude of individual effort; it is a way to express how much, on average, each person pays. In the United States, comparative analysis of per capita tax among the 50 states is a common practice, as seen in USCB (2024c) and Johns (2025).
Table 14 offers a comparison of per capita tax in Puerto Rico, the United States, and the 50 states. The per capita tax in Puerto Rico, with respect to state and local taxes, is $4,979. The U.S. average is $7,073. The state with the lowest state per capita tax is Tennessee, with $4,699, while the state with the highest is New York, with $12,732. The per capita tax in Puerto Rico is higher than that of the state with the lowest per capita tax level in the United States. This is the case even though personal income per capita in Tennessee is $59,099[52] and in Puerto Rico it is $25,711. The Island’s per capita tax also exceeds that of four other states.

9. Comparison of State and Local Taxation in Puerto Rico and Selected States
This section presents a comparative analysis of the tax system structures of Puerto Rico and a selection of U.S. states, chosen based on economic and social criteria. The selection criteria include: (a) states with a population similar to Puerto Rico’s, (b) states with high Puerto Rican migration, (c) states without an individual income tax, (d) states with the highest poverty levels, and (e) states with higher and lower levels of economic freedom. The comparison focuses on the individual characteristics of each state, since the observed breadth and dispersion prevent the group average from being a representative indicator, except in certain specific cases.
9.1. States With a Population Similar to Puerto Rico’s
Puerto Rico’s population in 2022 was 3,220,137. Three states—Iowa, Nevada, and Utah—have populations similar to that of Puerto Rico. The average population of these three states differs by only 1.1% from Puerto Rico’s. Table 15 presents a comparison of population levels and the relative composition of tax revenues by category in Puerto Rico and these states. It can be observed that, on average, these three states have a property tax share close to the national average, except for Iowa, where it is slightly higher. In contrast, Puerto Rico’s property tax share is very low (7.3%), which suggests that this type of tax is underutilized.
Nevada represents an extreme case of reliance on consumption taxes—accounting for 65.5% of its tax revenues—compared with the other two states with similar populations (Iowa and Utah) and with Puerto Rico. Nevada’s consumption tax base is broader than that of other states, and its rate is also among the highest. This reflects the fact that, within its tax structure, Nevada does not levy individual[53] or corporate income taxes. In contrast, Puerto Rico’s corporate income tax is substantially higher than both the U.S. average and that of the three states with similar population levels.

9.2. States With High Puerto Rican Migration
This analysis is useful for understanding fiscal policy structures in contexts of significant migratory mobility. While state tax policy is not always the determining factor in interstate relocation decisions, it often influences how individuals and businesses evaluate potential places of residence. In this regard, the tax systems of receiving states may play a relevant role in redistributing the tax base (Loughead, 2025). From a fiscal standpoint, Puerto Rico can be characterized as a sending jurisdiction, given that a significant share of taxpayers relocate each year to jurisdictions outside the Island, primarily to U.S. mainland states.
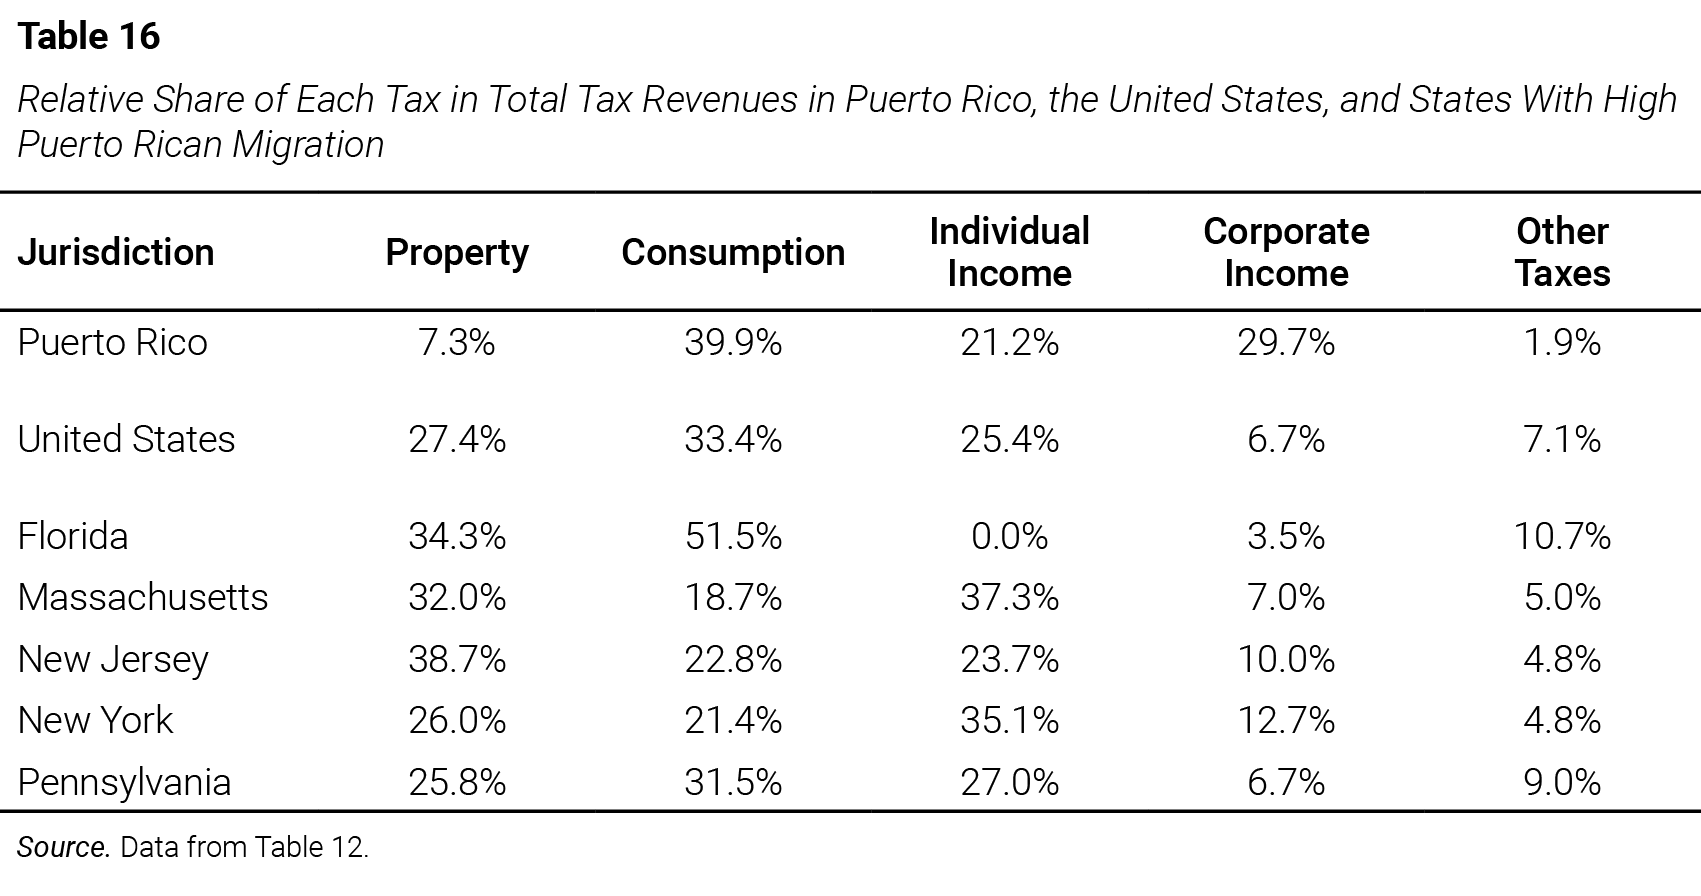
The receiving states absorb a substantial number of Puerto Rican migrant taxpayers, which has direct implications for the tax base and the territorial distribution of tax revenues. Approximately 60% of the Puerto Rican population residing in the United States is concentrated in five states. Florida leads with 21%, equivalent to about 1.2 million people. The other principal states are New York (17%), New Jersey (8%), Pennsylvania (8%), and Massachusetts (6%) (Moslimani et al., 2023). This pattern of population mobility presents important challenges for medium- and long-term fiscal planning.
Florida and Puerto Rico both exhibit a high reliance on consumption taxes; however, Puerto Rico levies individual income taxes, whereas Florida does not. The growing Puerto Rican population in Florida may contribute to increased revenues from consumption and property taxes. In contrast, the other four states referenced show a higher average share of individual income tax revenues than Puerto Rico, and a lower share of consumption-based revenues. These disparities underscore significant differences in tax system composition, which may influence economic mobility decisions and migration-related tax incentives.
The potential fiscal impact of cumulative tax revenues not received in Puerto Rico due to net migration between 2008 and 2022 was estimated at $1,158.8 million. Of this amount, individual income tax accounted for $634.0 million; Sales and Use Tax, $339.7 million; and excise taxes and lottery revenues, $184.8 million.[54] The projected population loss poses a risk to Puerto Rico’s economic growth and future stability, as a smaller working-age population leads to reduced employment-related tax revenues and diminished economic activity (U.S. Government Accountability Office, 2025).
This migration pattern contributes to a redistribution of the tax burden across jurisdictions by reshaping the demographic and economic profile of taxpayers. Conversely, sustained emigration undermines Puerto Rico’s revenue collection capacity, particularly in sectors already subject to fiscal strain or low formal participation. Beyond its direct impact on collections, this interjurisdictional dynamic raises broader concerns about tax equity and system efficiency. A nuanced understanding of these migratory movements is essential for crafting fiscal policies that align with the demographic realities of both Puerto Rico and the receiving states.
9.3. States Without an Individual Income Tax
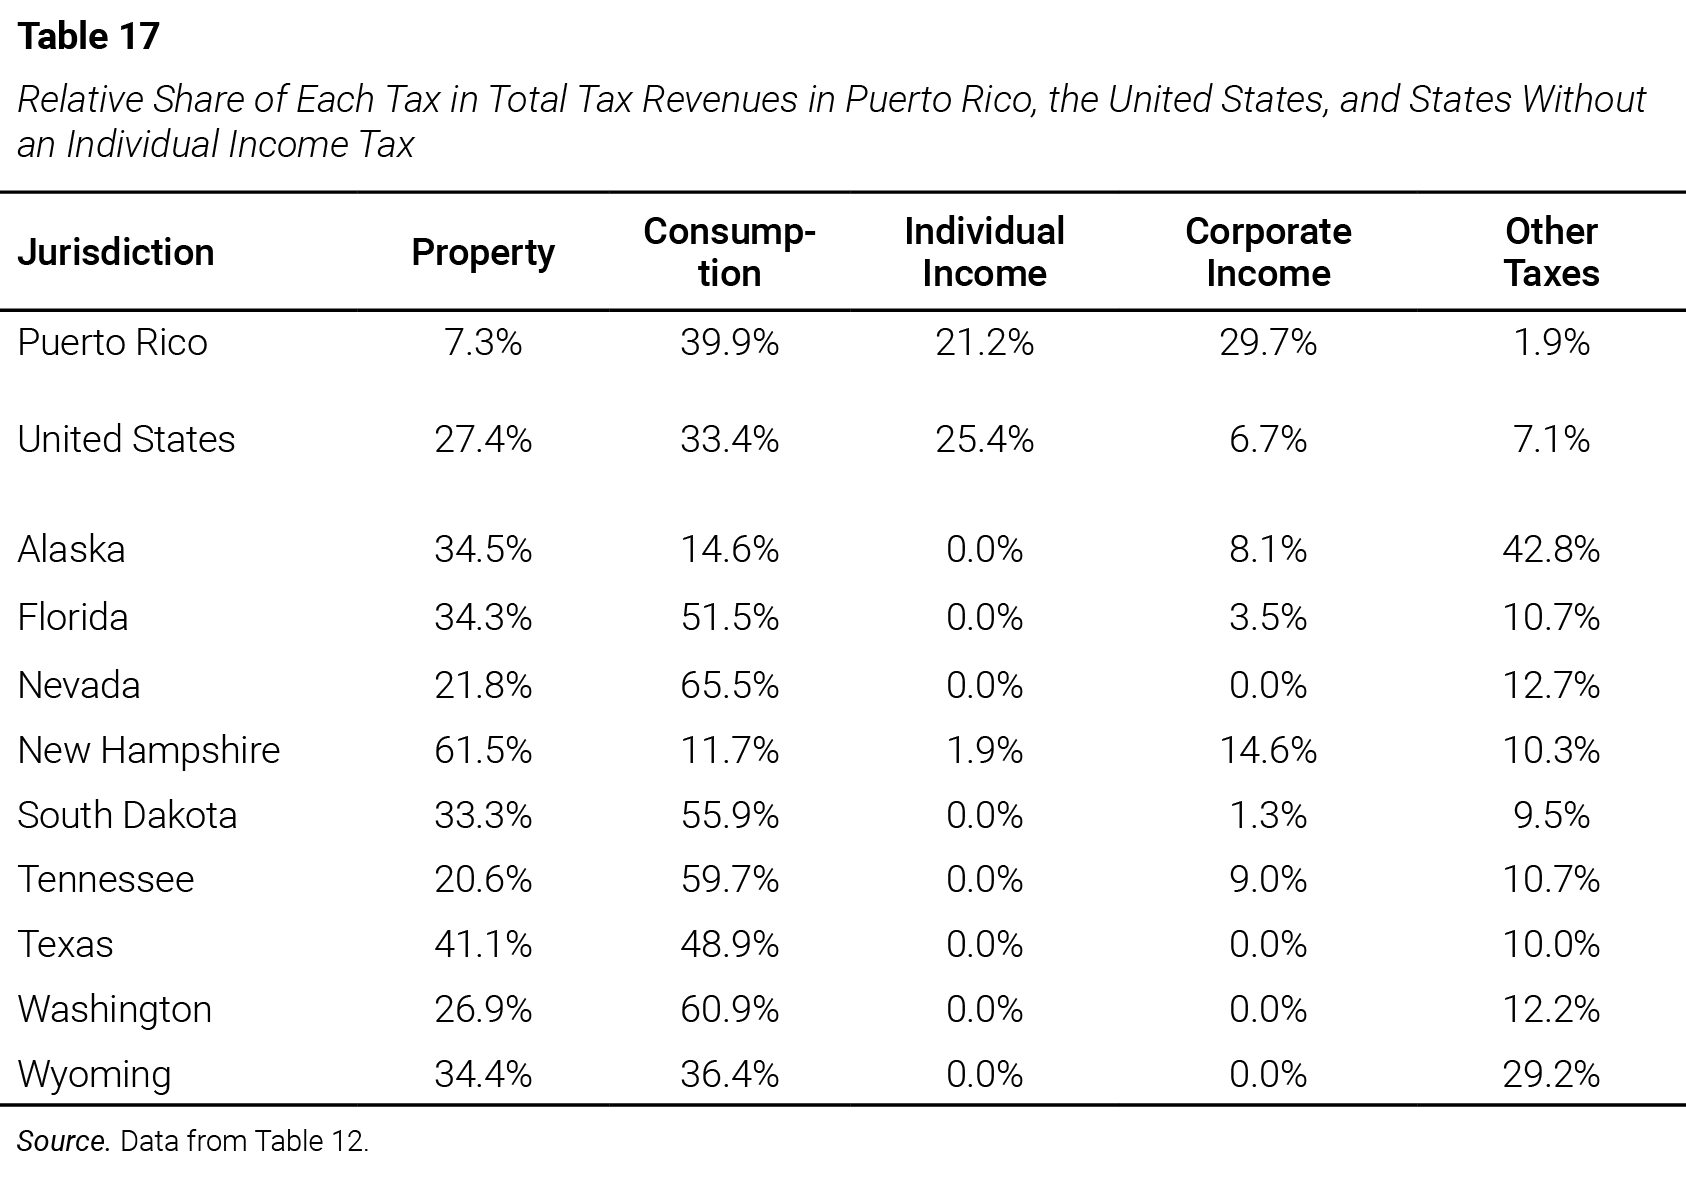
Another criterion for comparing Puerto Rico with the 50 states is the analysis of those that do not impose personal income taxes at the state level. This allows for a more equitable examination of jurisdictions that, like Puerto Rico, tax personal income at only one level of government. The states that do not levy personal income taxes are Alaska, Florida, Nevada, New Hampshire, South Dakota, Tennessee, Texas, Washington, and Wyoming. In these states, fiscal structures rely primarily on consumption taxes on goods and services, property taxes, and the “Other Taxes” category, which alters the composition of their overall tax revenues.
The share of these three tax categories in total revenues exceeds the U.S. average in the states mentioned. It is worth noting that Alaska, in addition to not levying a personal income tax, also does not impose a general sales tax; however, it allows local taxation, making its fiscal structure unique compared to other states. Wyoming, by contrast, relies heavily on revenues generated from natural resource extraction taxes and receives federal royalties from mineral extraction on public lands—constituting a key source of funding for its state budget (Schuhmann & Jensen, 2022).
9.4. States With the Highest Poverty Levels
Comparing state and local taxation in Puerto Rico with that of U.S. states with higher poverty levels is relevant for understanding how fiscal structures affect their residents. In 2022, the percentage of the U.S. population living below the poverty line was 12.4%. New Mexico recorded the highest rate, at 20.2%, followed by Mississippi at 18.4%. Utah—one of the states with a population comparable to Puerto Rico’s—had the lowest poverty rate, at 6.0%. According to data published by the U.S. Census Bureau (USCB, 2024b), Puerto Rico’s poverty rate was 41.7%, representing a substantial gap relative to state averages.
As expected, given the poverty levels, the share of individual income tax and property tax revenues in New Mexico and Mississippi is below the U.S. average—25.4% and 27.4%, respectively. By contrast, most of their fiscal revenues come from consumption taxes on goods and services, which account for 38.3% in New Mexico and 45.7% in Mississippi. This taxation pattern reflects a fiscal strategy centered on generating revenue through daily economic activity rather than directly taxing individual income, which may influence the economic dynamics of residents in these jurisdictions.

9.5. States With Higher and Lower Levels of Economic Freedom
Economic freedom refers to “the capacity of individuals and organizations to decide how to use their resources and how to conduct economic activities without governmental interference” (Hlushchenko et al., 2024, p. 69). The degree of economic freedom in a society can be significantly affected by its tax burden, as taxation directly impacts the amount of disposable income available to individuals. It is also argued that “economic freedom is considered to have a positive effect on income inequality, since it means more liberalized policies” (Karakotsios et al., 2020, p. 207), which typically fosters a more favorable environment for investment, entrepreneurship, and innovation.[55]
Comparing state and local taxation in Puerto Rico with that of states with higher and lower levels of tax freedom allows for an assessment of how governments may protect individual liberty and private property—or restrict those rights through taxes, regulations, trade barriers, and monetary manipulation. The selection of states for this comparison was based on the Economic Freedom of North America 2024 report (Stansel et al., 2024). The indices published in this report measure the extent to which provincial, state, and local governments in Canada, the United States, Mexico, and Puerto Rico allow their citizens to make their own economic decisions.
The criterion used to select states was their ranking in the Area 2 “Taxes” component of the all-government index, which was considered the most relevant due to the variables it includes for comparing tax structures across jurisdictions. It is important to note the strong negative correlation between a state’s score in this component and its overall tax burden.[56] In general, the lower the tax burden, the higher the score and the better the state’s position in the index. This is consistent with the principle that as the tax burden increases, private choice is restricted and economic freedom declines.
Table 19 features the states selected based on their scores in the “Taxes” component.[57] States with stronger performance and higher tax freedom tend to rely more heavily on consumption taxes on goods and services—with the exception of New Hampshire, whose tax structure is primarily based on property taxes. In contrast, states with lower tax freedom show greater reliance on individual income taxes and lower shares of other taxes; however, in cases such as Delaware and New Jersey, revenues from other taxes and property taxes represent a more significant proportion.
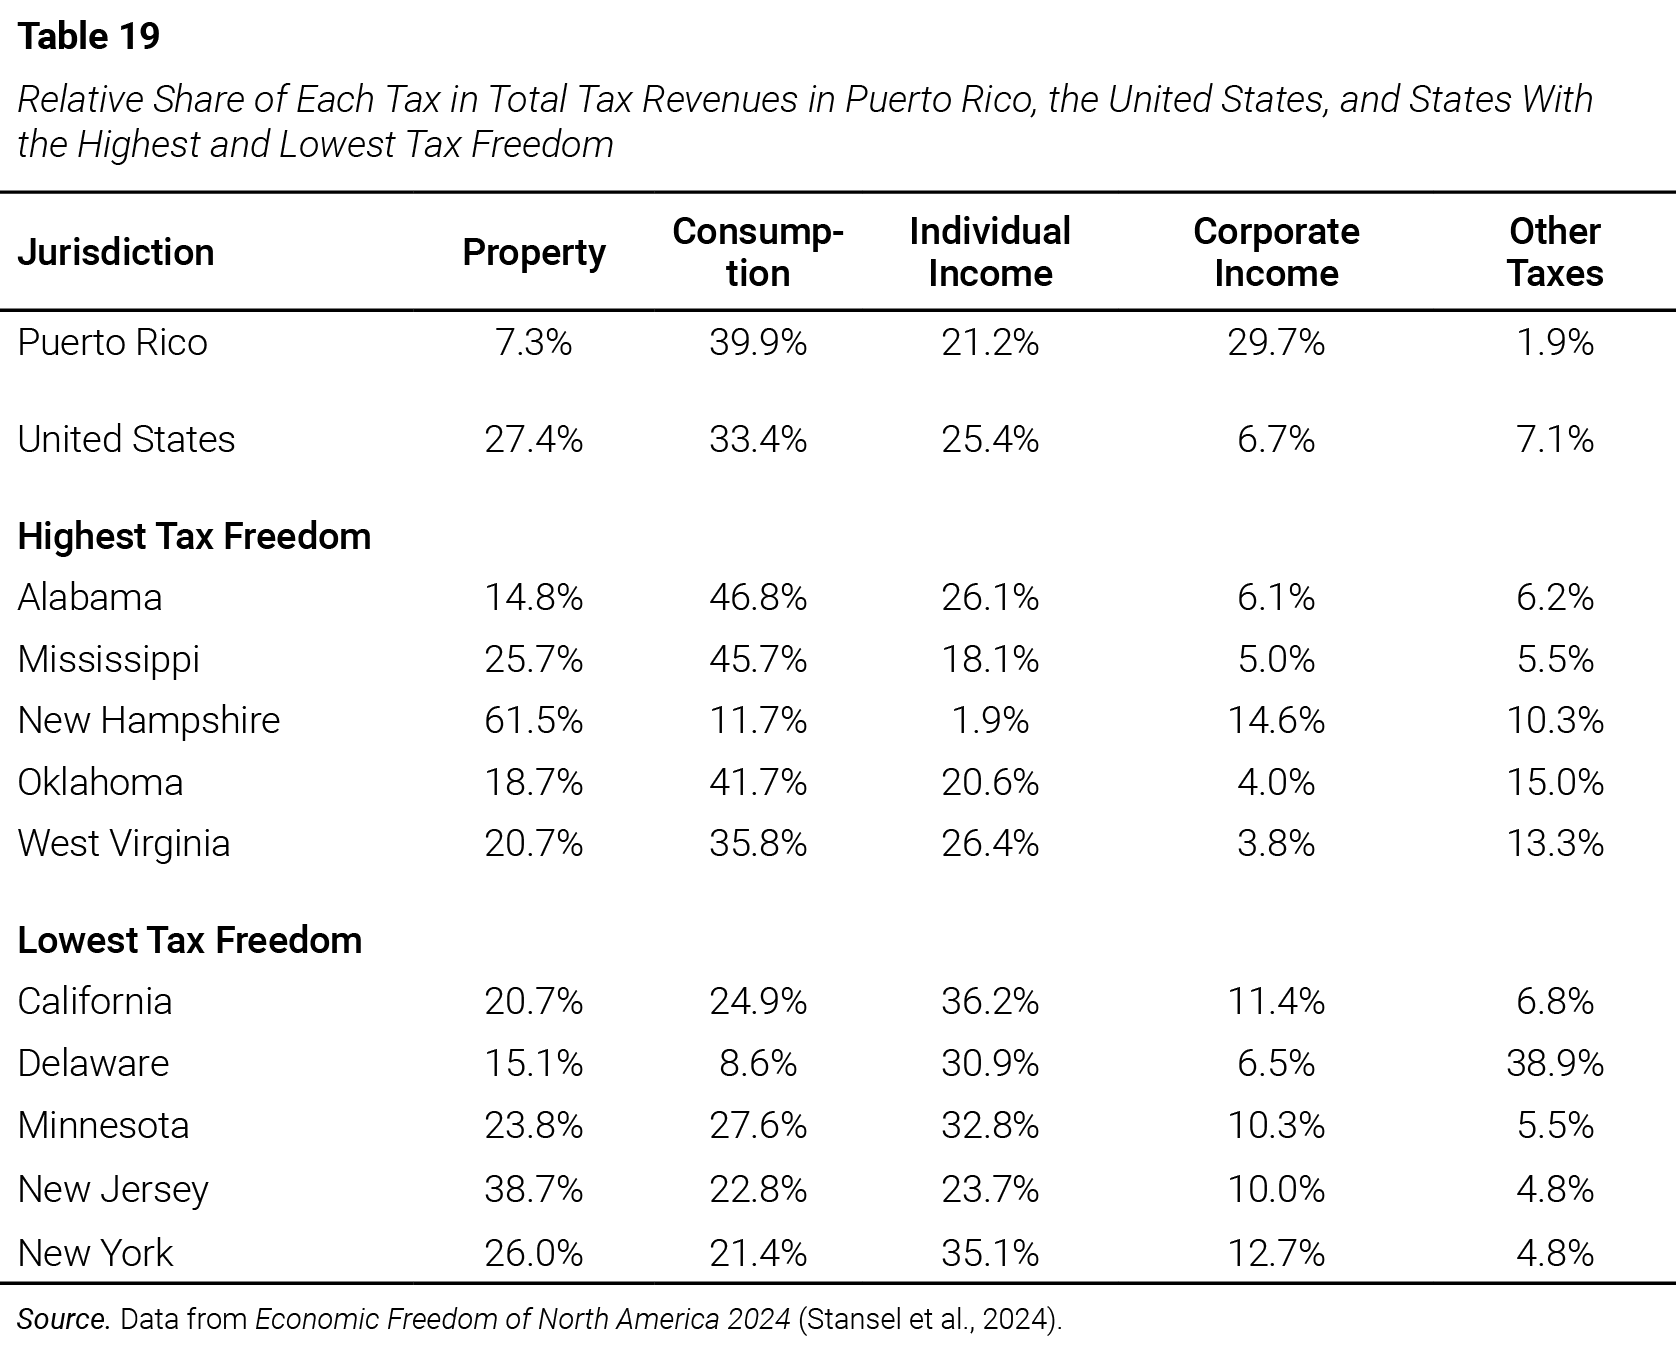
10. Comparison of Federal, State, and Local Taxation in Puerto Rico, the United States, and the 50 States
Federal taxation is considered an independent level of government, with its own sources of revenue and expenditure. As previously mentioned, federal tax rules are uniform across all states. From the standpoint of public policy and state-level fiscal analysis, what matters is what each jurisdiction can control and modify, since neither states nor territories have the authority to alter the structure of federal taxes. Even so, for individuals and businesses, it is important to understand the combined tax burden—federal, state, and local—to assess its fiscal impact on economic decision-making. For this reason, this section incorporates federal taxes and analyzes the effects of their integration.
Figure 7 indicates that 59.3% of federal revenues originate from individual income taxes, followed by 29.0% from contributions to social security systems—namely, payroll taxes—for a combined total of 88.3%. This pronounced concentration at the federal level means that, when aggregating tax revenues across all three tiers of government (federal, state, and local), income taxes constitute the largest relative share. The third-largest source within the federal tax structure is corporate income tax, accounting for 9.6%, while consumption and property taxes represent minimal shares of 1.5% and 0.6%, respectively.
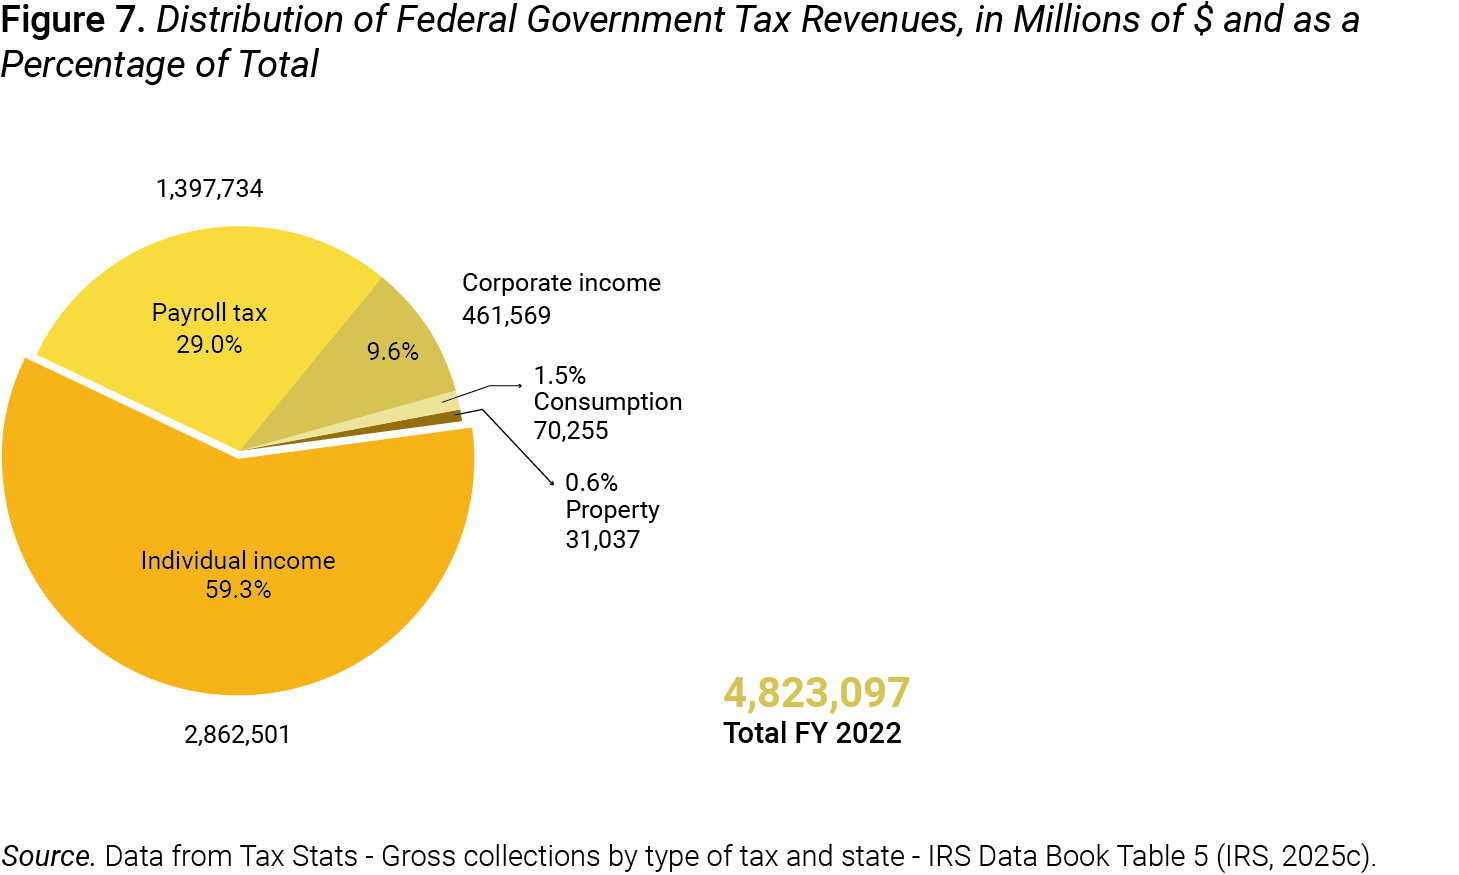
For comparative purposes between Puerto Rico and the states, this study presents a tabulation that includes total federal, state, and local taxes for each state. The data were compiled specifically for this analysis, as no existing source was identified that publishes the combined federal, state, and local tax figures disaggregated by state. The only comparable reference found is the publication Revenue Statistics 2024: Health Taxes in OECD Countries (OECD, 2024), which reports total combined taxes by category across federal, state, and local levels, but does not disaggregate them by state, as is done here.
To obtain state-level fiscal revenue data, two government sources were used: the table State and Local Government Finances by Level of Government and by State: 2022 (USCB, 2022) and the table Gross Collections, by Type of Tax and State, Fiscal Year 2022 (IRS, 2025c). As shown in Table 20, the resulting tabulation indicates that combined tax revenues total $7,180,709 million, of which $4,823,097 million correspond to the federal government, representing 67% of the total.[58] State and local governments, collectively, contribute $2,357,612 million, equivalent to 33% of total revenues across the three levels of government.
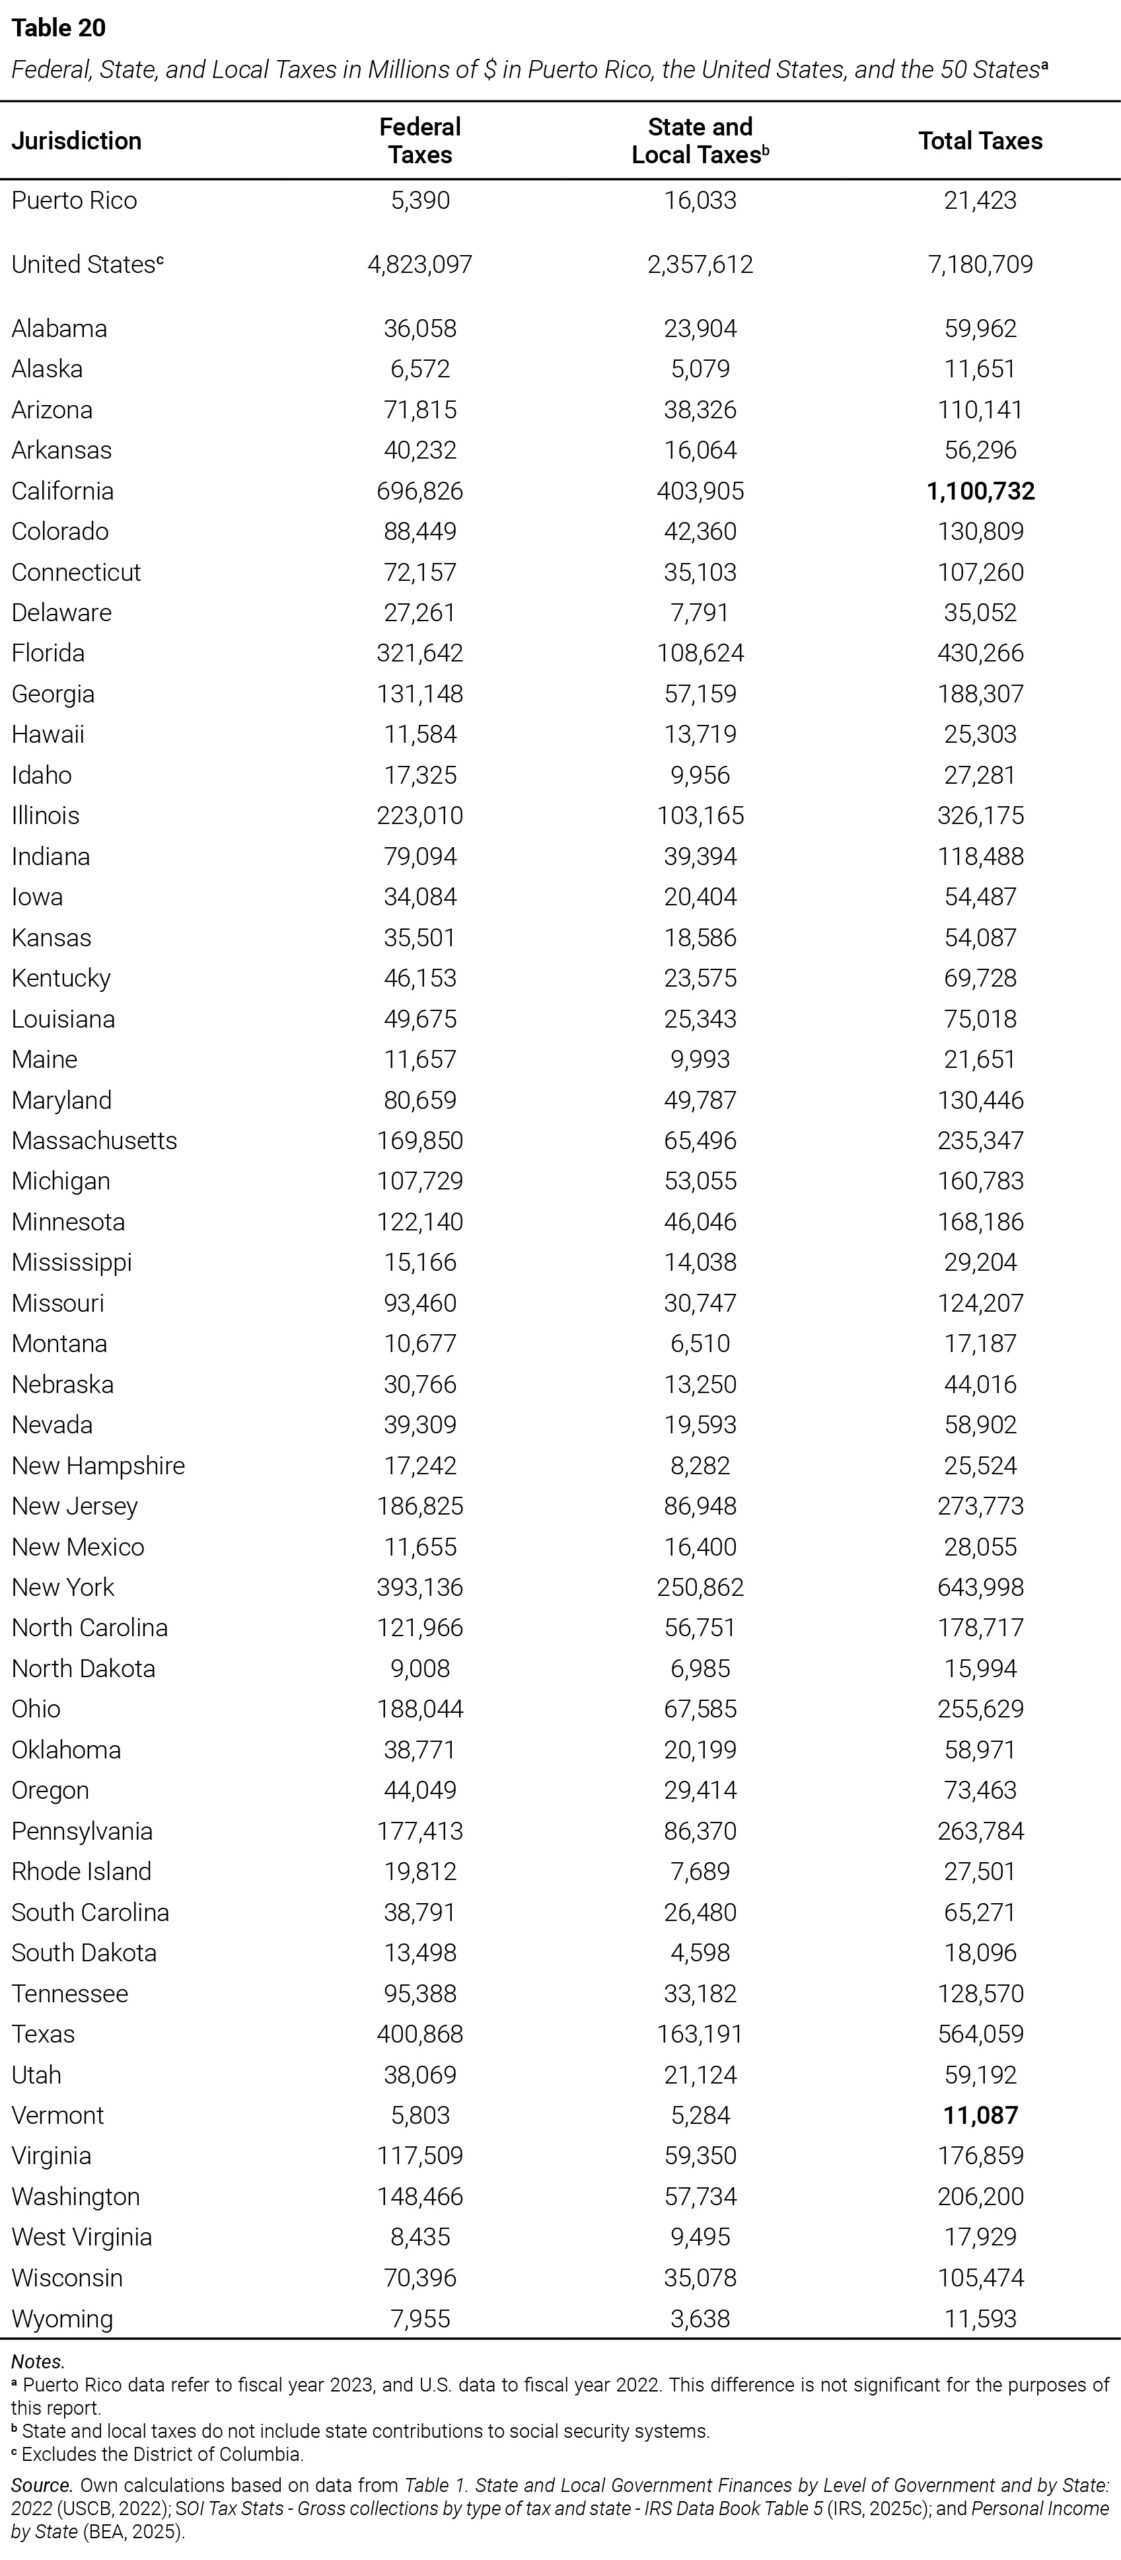
10.1. Total Tax Burden in Puerto Rico, the United States, and the 50 States
As previously noted, the tax burden is a measure of the total taxes levied by the government, which “includes, but is not limited to, direct taxes in terms of higher marginal tax rates on individual and corporate incomes, and also to general taxes, including all forms of direct and indirect taxes that apply to all government levels [emphasis added], as a percentage of the GDP” (Cervelló-Royo et al., 2023, pp. 4–5). In the case of the United States, these levels are federal, state, and local; and the inclusion of all three in the calculation of the tax burden allows for the most accurate possible assessment of total fiscal obligation within each jurisdiction.
The total tax burden for each of the 50 states—based on the combined taxes paid at the federal, state, and local levels—is not reported in the sources that commonly measure this indicator. This is because tax burden analyses in the United States generally exclude federal taxes and consider only state and local levies. Such a method yields a limited record, as it fails to reflect the actual weight of taxation on taxpayers. In this study, the total tax burden was calculated by compiling data from all three levels of government, so that the resulting computation would fully capture the fiscal effort borne by state residents.
The comparison of Puerto Rico’s total tax burden, the United States average, and the 50 states—presented in Table 21—is based on reported taxes paid at the federal, state, and local levels in each jurisdiction. Puerto Rico’s total tax burden, measured as a proportion of GDP, is 18.2%. The calculation conducted for comparative purposes found that the average total tax burden in the United States amounts to 27.9%.[59] Among the 50 states, Alaska registers the lowest total tax burden, at 17.6%, while Delaware reports the highest, at 37.9%. Puerto Rico’s total tax burden is higher than Alaska’s and equal to that of West Virginia.
Table 21 also presents Puerto Rico’s total tax burden, based on taxes paid at the federal, state, and local levels, measured as a proportion of GNP, which amounts to 23.9%. This percentage exceeds that of 12 states, including Iowa and Utah—two jurisdictions with populations comparable to Puerto Rico’s. It is also similar to that of 2 states, and only about one percentage point below that of 10 other states, among them several with dynamic economies such as North Carolina. This means that, even though Puerto Rico pays partial federal taxes, the tax burden borne by its residents is higher than or comparable to that of 24 states where individuals are subject to the full range of federal taxation.
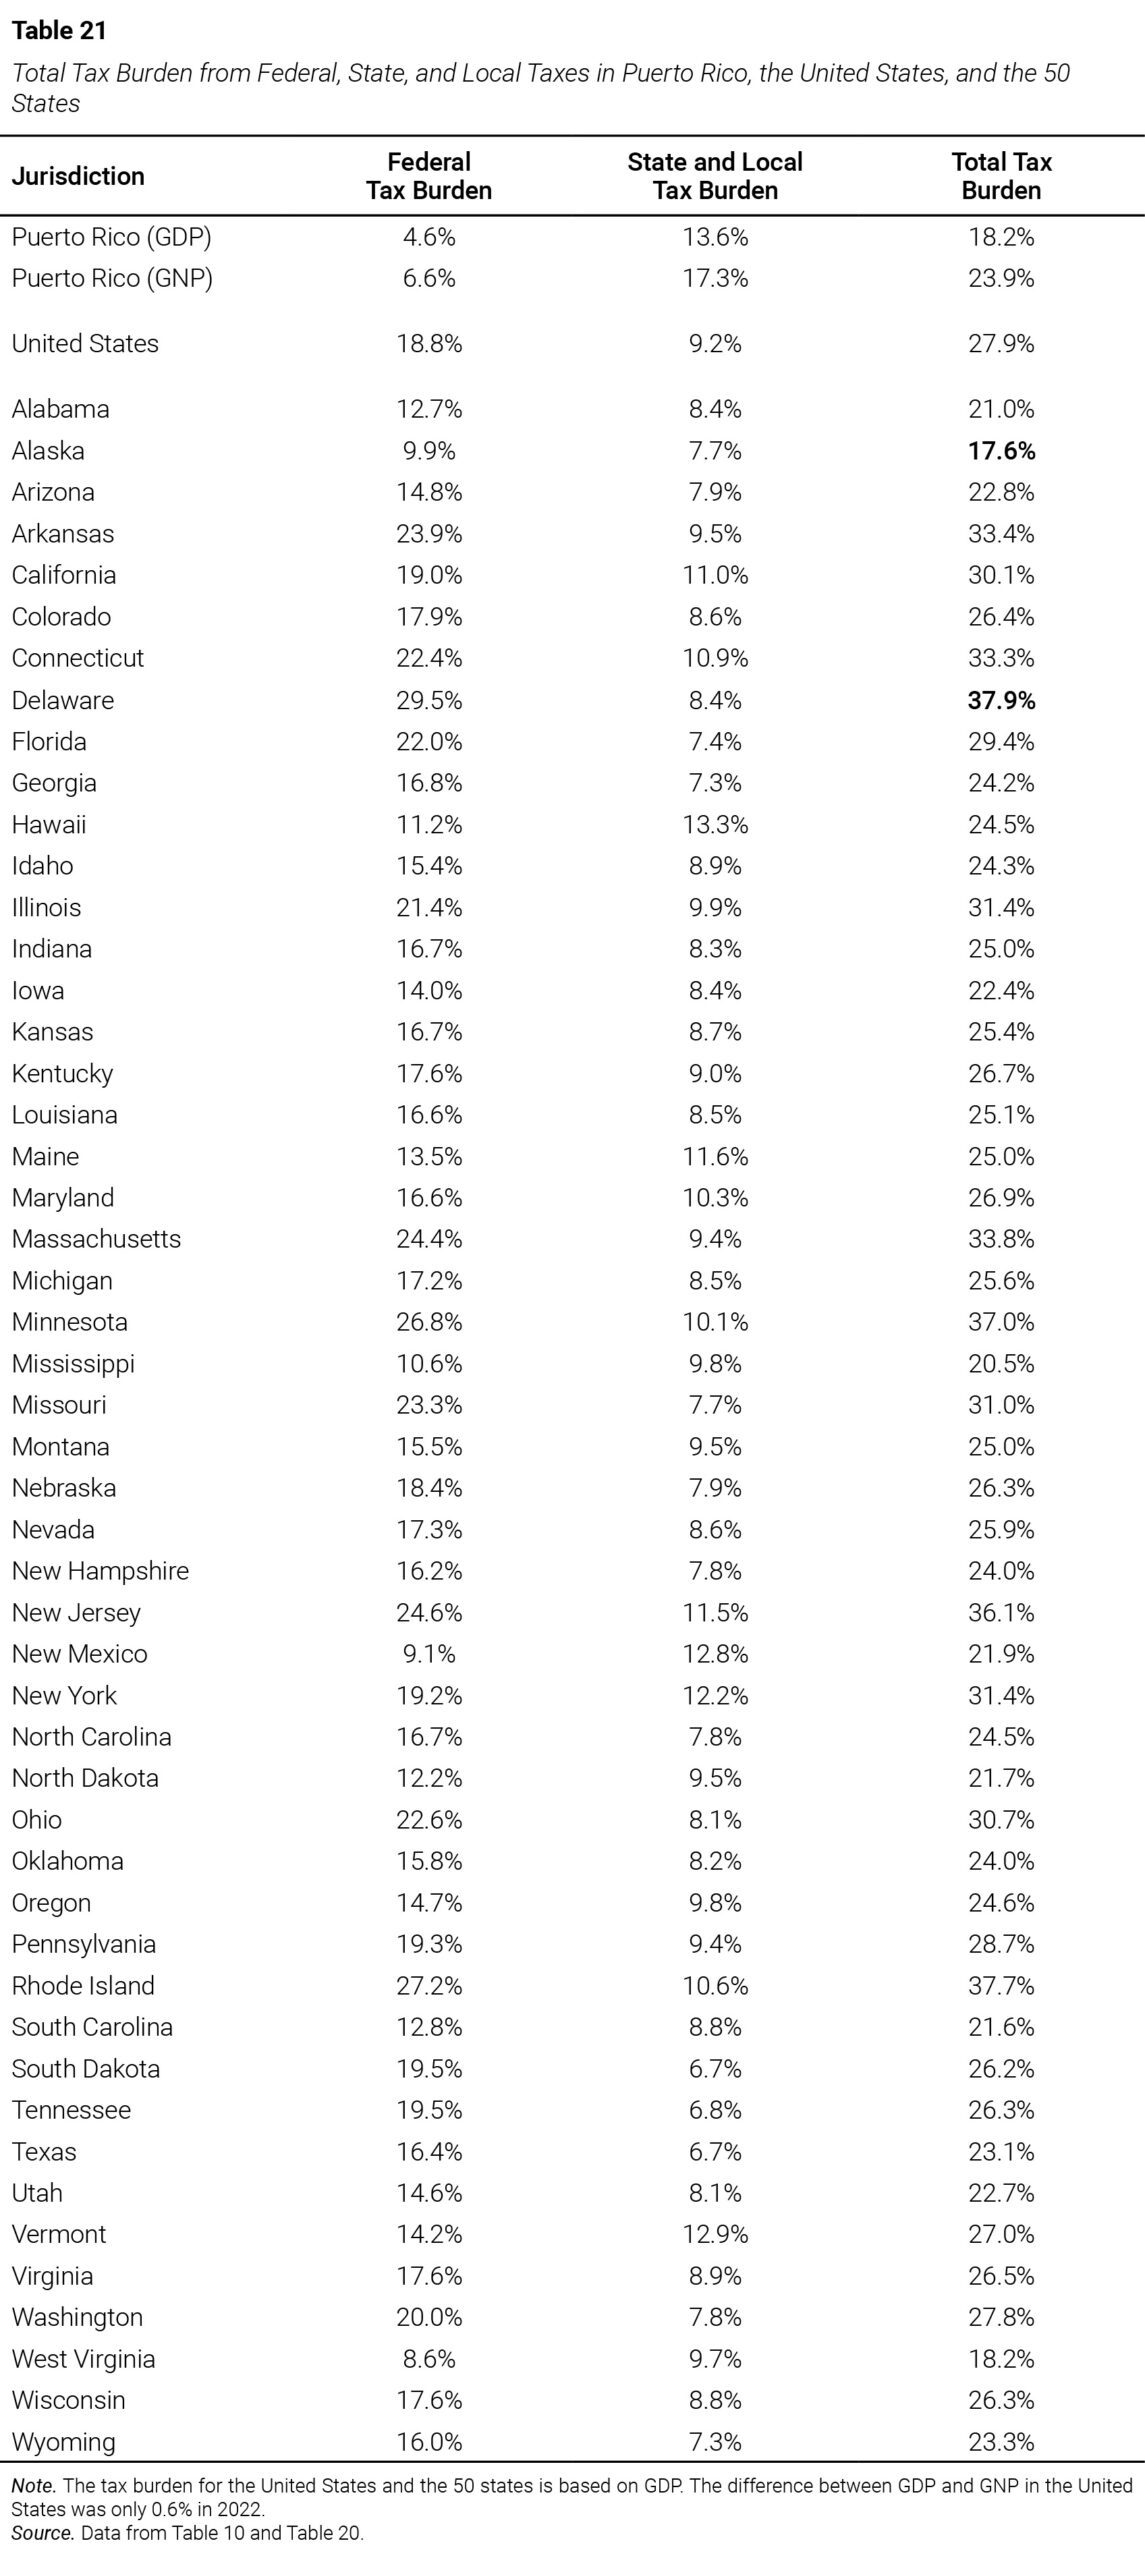
10.2. Total Per Capita Tax in Puerto Rico, the United States, and the 50 States
As in the analysis of tax burden, per capita tax in the United States is not calculated at the federal level, but only at the state and local levels. It is important to clarify that tax burden is measured in relative terms—that is, it indicates what proportion of total economic output is allocated to tax payments per dollar generated. In contrast, the per capita value is an indicator of the average amount each person pays in absolute terms. This distinction is significant because the inclusion of federal taxes in the calculation of total per capita tax, in this study, affects both the relative burden and the per capita values of taxes paid.
It is to be expected that higher income levels result in greater payments of income and consumption taxes; for this reason, a society with a high tax burden but low income would have a lower per capita tax than a society with a low tax burden and high income. Although federal taxation is uniform across all states, the total amount of taxes collected varies according to the diversity of economic activity (e.g., agriculture, industry, services, technology) and the demographic and social profile of each state’s population.[60] This means that comparisons of total per capita tax across jurisdictions must be interpreted in light of their productive structure and socioeconomic conditions.[61]
Table 22 presents a comparison of federal, state, and local per capita taxes. In 47 states, the federal per capita tax exceeds the state and local per capita tax; the exceptions are Hawaii, New Mexico, and West Virginia. The federal per capita tax in Puerto Rico is $1,674, while the lowest among the states is $4,754. At the state and local level, Puerto Rico’s per capita tax ($4,979) is below the U.S. average ($7,073), but exceeds that of Tennessee, Alabama, Mississippi, and Florida. Puerto Rico’s state and local per capita tax surpasses the level recorded in several states with higher per capita income, underscoring a significant relative burden at the subnational level.[62]
When calculating the combined revenue from all levels of government—federal, state, and local—Puerto Rico’s total per capita tax is lower than both the U.S. average and that of each individual state. This difference can largely be attributed to two factors: (a) the Island’s economic activity is less diversified than that of any state; and (b) Puerto Rico’s personal per capita income in 2023 ($25,711) is lower than the U.S. average ($66,027) and also lower than that of Mississippi ($47,086), which has the lowest per capita income among the states. Taken together, these data reflect Puerto Rico’s partial participation in the federal tax system and its distinct structural and socioeconomic characteristics.
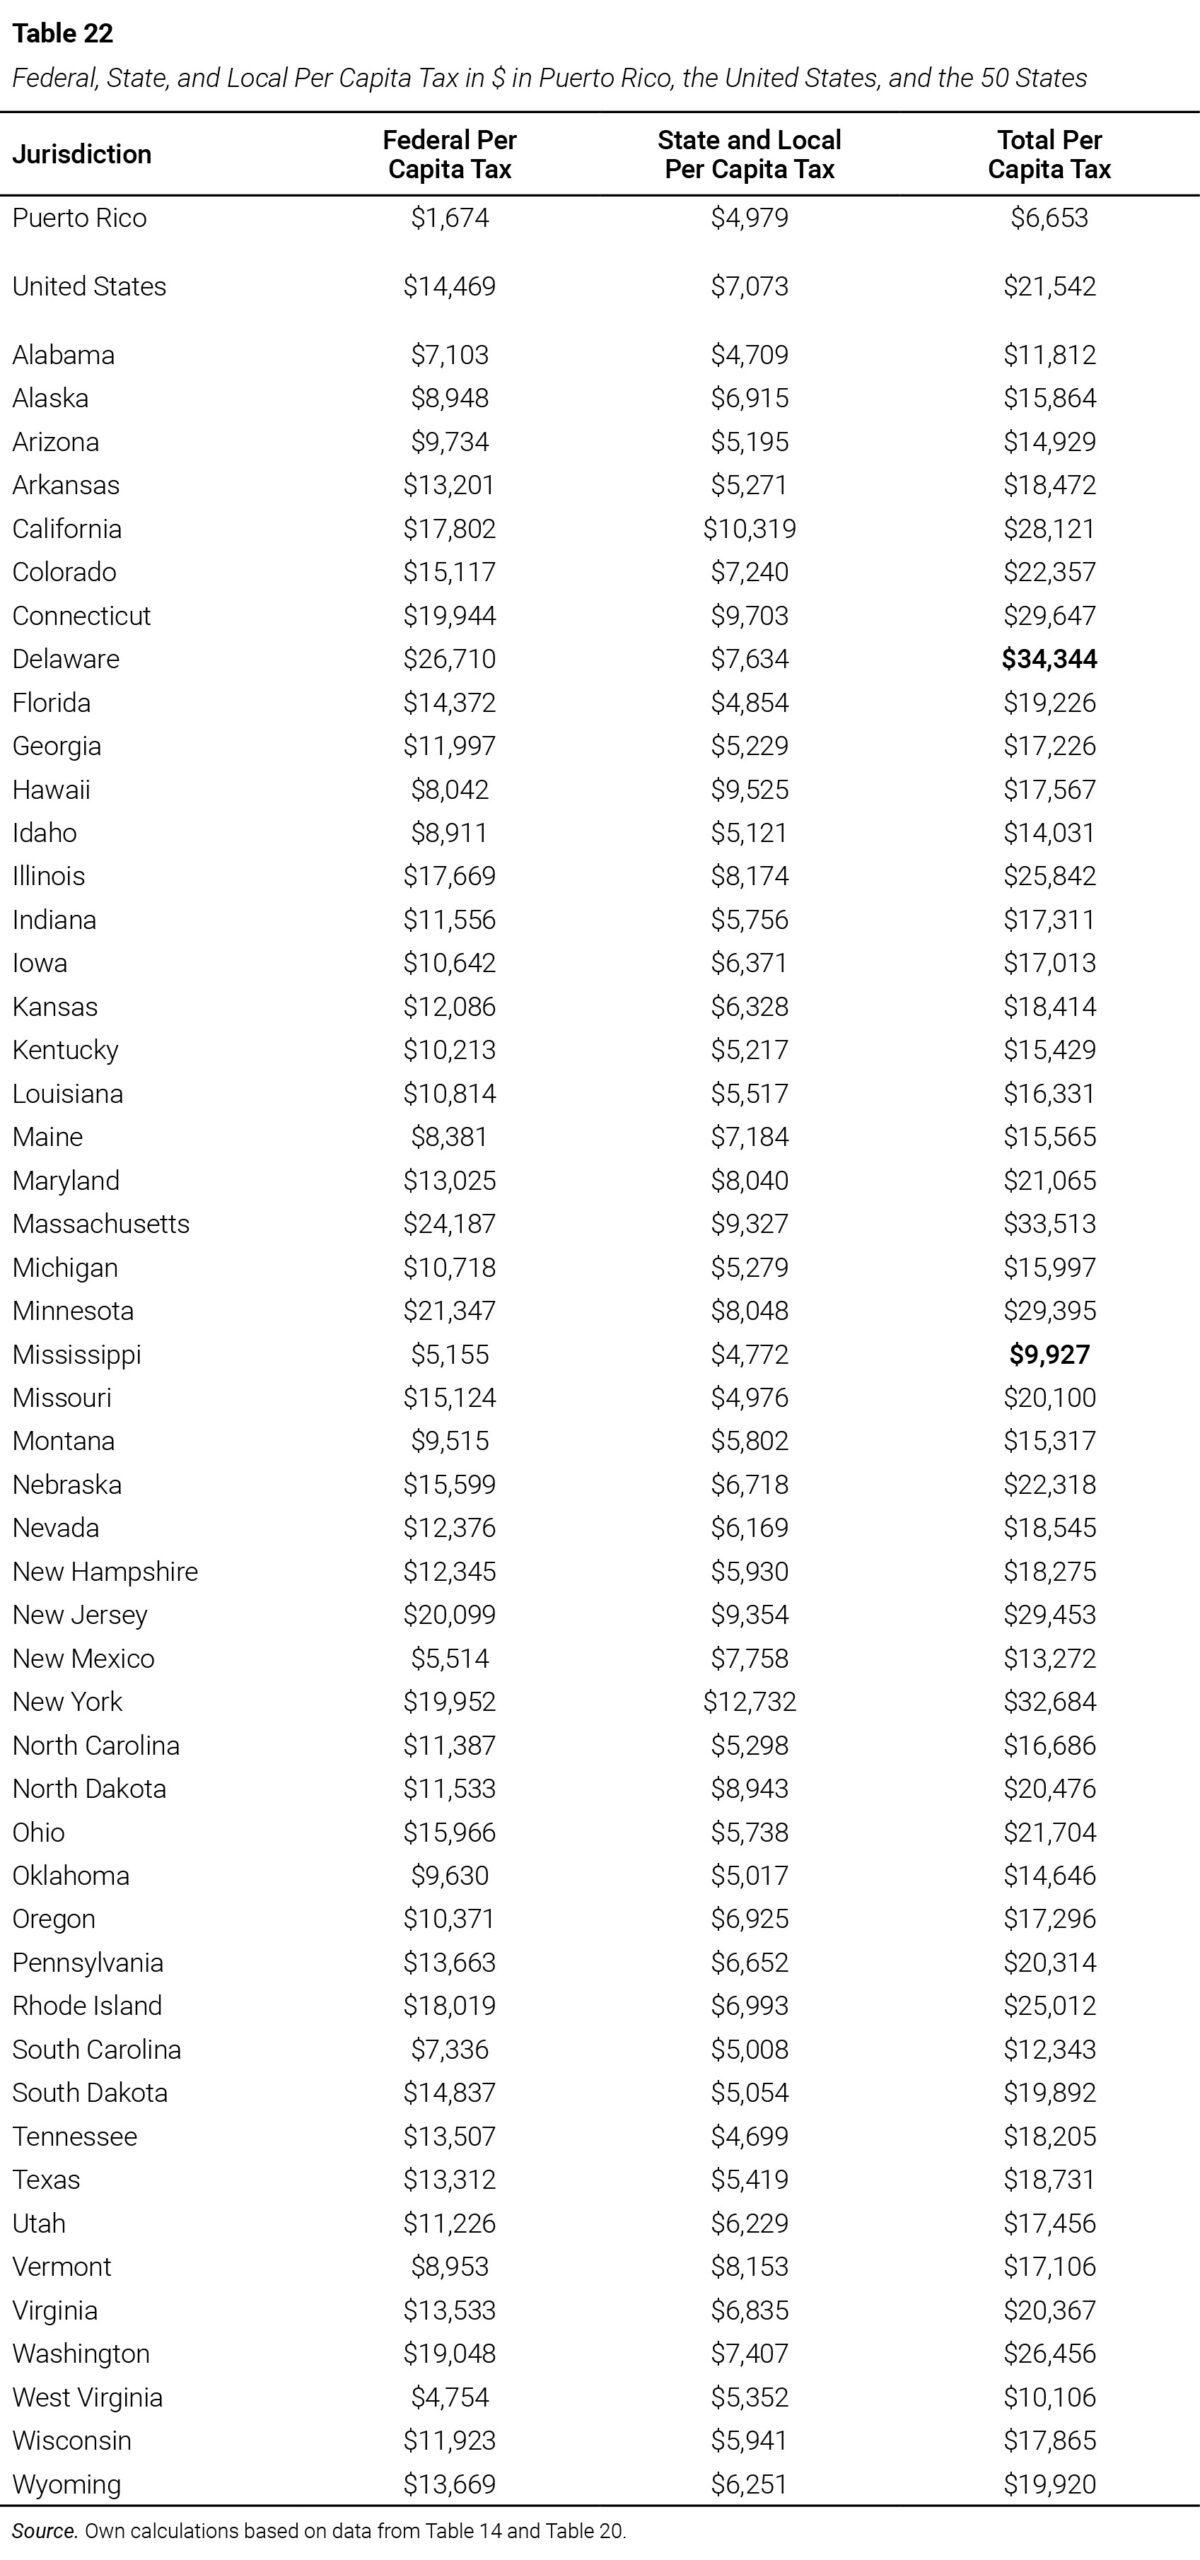
11. Conclusion
Puerto Rico’s tax system is complex, fragmented, and structurally unique. This study enabled the identification, organization, and analysis of its essential components—from the legal foundations and revenue levels to residents’ tax obligations and the system’s connections to the federal framework. The result is a comprehensive view of the Island’s tax landscape, encompassing federal, state, and local taxes paid, and documenting the burdens faced by individuals, businesses, and the external sector of the economy. The analysis reveals that partial disconnection from the federal system does not necessarily translate into a lower tax burden for Puerto Rico’s residents.
One of the report’s contributions is the development of a methodological framework for analyzing Puerto Rico’s tax burden using criteria aligned with its economic structure. The combined use of GDP and GNP, along with the distinction between taxes paid by residents and those paid by the external sector, provides a clear, precise, and useful approach for comparative studies. The report also documents regulatory dispersion, the absence or lack of integration of databases—particularly at the municipal level—the lack of transparency surrounding certain fiscal revenues, and the high reliance on indirect taxes and preferential regimes for external capital.
Beyond the identification of tax categories and levels of public revenue, the analysis of Puerto Rico’s tax burden yields a fundamental conclusion: the perception that Puerto Rico residents pay less in taxes than those living in the 50 states is not supported by empirical evidence. Although the federal system provides the Island with a differentiated fiscal treatment, the federal taxes paid in Puerto Rico, combined with state and local collections and the actual tax burden borne by its residents, are in many cases comparable to those of various U.S. jurisdictions where individuals are required to pay the full array of federal, state, and local taxes.
The findings confirm that Puerto Rico’s tax system is characterized by a fragmented legal architecture spanning numerous laws and amendments, a high degree of regulatory segmentation, and limited availability of federal, state, and municipal data. The coexistence of these three levels of revenue collection adds complexity to tax administration and constrains fiscal governance and transparency. This calls for a clear distinction between the overall fiscal burden on the economy and the effective tax obligations faced by residents. Moreover, the opacity surrounding certain municipal revenues and the absence of standardized records hinder rigorous analysis and the precise measurement of fiscal effort.
Based on the study’s findings, the principal public policy recommendation is the need for a comprehensive tax reform to address the structural deficiencies of the current system. This reform should adopt a systemic approach that acknowledges the interaction among different taxes and levels of government, and that promotes a more coherent, efficient, and equitable fiscal structure. The reform must be undertaken alongside a review of public expenditure. The fiscal system comprises both revenue and spending, and their alignment is essential to achieving equity, efficiency, and sustainability. A thorough expenditure analysis is required, aimed at reducing its volume and enhancing its effectiveness, transparency, and redistributive impact.
The strategic guidelines or guiding principles of the reform should include: (a) reducing the tax burden on residents and businesses; (b) redistributing that burden more equitably; (c) reviewing and reconfiguring the fiscal structure; (d) broadening the tax base by assessing the costs and benefits of preferential tax treatments; (e) decentralizing fiscal administration through a more equitable redistribution of revenues between the central government and municipalities; (f) simplifying the tax system; (g) developing a public platform to consolidate and standardize municipal revenues, including those generated through local ordinances; and (h) increasing transparency in collections by category and type of tax.
The study provides an empirical foundation and technical inputs for future research. It is pertinent to explore, among other topics: (a) the potential of the property tax; (b) the impact of exemptions and incentives; (c) the effect of economic freedom on fiscal performance; (d) the relationship between the tax system and population migration; and (e) the influence of the tax burden on compliance and economic formality. Understanding the tax system not merely as a revenue-generating instrument, but as a reflection of economic and social priorities, is essential to building a simpler, more equitable model aligned with the principles of fiscal justice and sustainable economic development.
12. Acknowledgments
The authors express their gratitude to Dean Stansel, Gerald Silverstein, and Ramón J. Cao García for their willingness to respond to our inquiries. They also acknowledge the contributions of José Luis Mendoza and Andrés I. García regarding the estate tax applicable to Puerto Rico residents under the federal Internal Revenue Code. Finally, they extend their thanks to John R. Stewart, Naji Khoury, Kenneth Rivera-Robles, and Henry Keenan for their diligent responses to our questions; to Josué E. Rivera Castro, Sebastián Negrón Reichard, and José Luis Rivera Rivera for their availability and support; and to Jorge L. Rodríguez and Luz N. Fernández López for their meticulous reading and critique of the manuscript.
13. Conflict of Interest Statement
This study was sponsored by the Puerto Rico Institute for Economic Liberty, an independent, nonprofit think tank. The research was conducted autonomously, with full academic freedom. The content of the report reflects exclusively the professional rigor and critical judgment of its authors; accordingly, they declare no conflict of interest in the preparation of this work.
14. References
Aidt, T. S., & Jensen, P. S. (2009). The taxman tools up: An event history study of the introduction of the personal income tax. Journal of Public Economics, 93(1-2), 160‒175.
American Rescue Plan Act of 2021, Pub. L. No. 117-2, 135 Stat. 4 (2021). https://www.congress.gov/bill/117th-congress/house-bill/1319
Benedicto, F. (2016). Tax administration in Tanzania: An assessment of factors affecting tax morale and voluntary tax compliance towards effective tax administration. International Journal of Finance and Accounting, 5(2), 90–97. https://doi.org/10.5923/j.ijfa.20160502.03
Bird, R. M., Martinez-Vazquez, J., & Torgler, B. (2008). Tax effort in developing countries and high income countries: The impact of corruption, voice and accountability. Economic Analysis and Policy, 38(1): 55–71.
Boccia, R. (2024, August 21). Five reasons why Social Security is an income transfer program, not an “earned benefit.” https://www.downsizinggovernment.org/five-reasons-why-social-security-income-transfer-program-not-earned-benefit
Brys, B., Perret, S., Thomas, A., & O’Reilly, P. (2016). Tax design for inclusive economic growth. OECD Taxation Working Papers, 26. OECD Publishing. https://doi.org/10.1787/5jlv74ggk0g7-en.
Bureau of Economic Analysis. (2025). Personal income by state. https://www.bea.gov/data/income-saving/personal-income-by-state.
Burman, L. E., & Slemrod, J. (2020). Taxes in America: What everyone needs to know. 2nd ed. Oxford University Press.
Cao García, R. J. (2004). Impuestos en Puerto Rico treinta años de experiencias y estudios. Grupo Editorial Akron.
Cappelen, A. W., & Tungodden, B. (2012). Tax policy and fair inequality. NHH Department of Economics Discussion Paper, 3/2012.
Carrión-Tavárez, Á. (Ed.). (2023). Doing business North America 2022 report (4th ed., Compendium). Center for the Study of Economic Liberty, Arizona State University. https://doi.org/10.53095/13583003
Carrión-Tavárez, Á., Carpenter II, D. M., & Timmons, E. J. (2024, febrero). Liberar el potencial. Las cargas de las licencias ocupacionales y cómo se pueden reformar en Puerto Rico. Instituto de Libertad Económica. https://doi.org/10.53095/13584010
Catalá Oliveras, F. A. (2013). Promesa rota una mirada institucionalista a partir de Tugwell. Ediciones Callejón.
Celikay, F. (2020). Dimensions of tax burden: A review on OECD countries. Journal of Economics, Finance and Administrative Science, 25(49), 27‒43. https://www.emerald.com/insight/content/doi/10.1108/jefas-12-2018-0138/full/pdf
Centro de Recaudación de Ingresos Municipales. (2025, 14 de marzo). Tipos contributivos año fiscal 2025-2026. https://portal.crim360.com/crimpr/CMS/DOCUMENTOS/download/362.pdf
Certain residents of possessions considered nonresidents not citizens of the United States, 26 U.S.C. § 2209 (1960). https://uscode.house.gov/view.xhtml?path=/prelim@title26/subtitleB/chapter11&edition=prelim
Cervelló-Royo, R., Devece, C., & Blanco-González Tejero, C. (2023). Economic freedom influences economic growth and unemployment: An analysis of the Eurozone. Ekonomska Istraživanja, 36(2) 2175007, 1‒15. https://doi.org/10.1080/1331677X.2023.2175007
Chindengwike, J., & Kira, A. R. (2022). The effect of tax rate on taxpayers’ voluntary compliance in Tanzania. Universal Journal of Accounting and Finance, 10(5), 889‒896. https://doi.org/10.13189/ujaf.2022.100501
Código Municipal de Puerto Rico, Ley Núm. 107 de 13 de agosto de 2020, según enmendada (2020 & rev. 2025). https://bvirtualogp.pr.gov/ogp/Bvirtual/leyesreferencia/PDF/107-2020.pdf
Colegio de Contadores Públicos Autorizados de Puerto Rico. (2025). Tipos contributivos. https://www.colegiocpa.com/colegiados/tipos-contributivos/
Commonwealth of Puerto Rico Room Occupancy Rate Tax Act, Act No. 272 of September 9, 2003, as amended (2003 & rev. 2021). https://bvirtualogp.pr.gov/ogp/Bvirtual/leyesreferencia/PDF/2-ingles/272-2003.pdf
Controlled foreign corporations; United States persons, 26 U.S.C. § 957 (1999). https://www.law.cornell.edu/uscode/text/26/957
Departamento de Hacienda. (s.f.). Estadísticas de las planillas de contribución sobre ingresos de individuos / Individual income tax returns statistics. https://hacienda.pr.gov/inversionistas/estadisticas-y-recaudos-statistics-and-revenues/estadisticas-de-las-planillas-de-contribucion-sobre-ingresos-de-individuos-individual-income-tax-returns-statistics
Departamento de Hacienda. (2015, 19 de marzo). Modelo SC 2225 Planilla mensual de arbitrios sobre gasolina, «gas o diesel oil», combustible, petróleo crudo, derivados y otras mezclas de hidrocarburos. https://hacienda.pr.gov/sites/default/files/documentos/sc_2225_a_informativo.pdf
Departamento de Hacienda. (2022 July 20). Form AS 2915.1 Sales and Use Tax and Tax on Imports Monthly Return. https://hacienda.pr.gov/sites/default/files/documentos/as_2915.1_rev._jul_20_22_informative.pdf
Departamento del Trabajo y Recursos Humanos. (2021). Sinot. https://trabajo.pr.gov/sinot.asp
Deyganto, O. (2018). Factors influencing taxpayers’ voluntary compliance attitude with tax system: evidence from Gedeo zone. Universal Journal of Accounting and Finance. 6(3), 92‒107. https://doi.org/10.13189/ujaf.2018.060302
Daley, J., & Coates, B. (2015). Property taxes. Grattan Institute. https://grattan.edu.au/wp-content/uploads/2015/07/826-Property-Taxes.pdf
Dick, D. L. (2015). U.S. tax imperialism in Puerto Rico. American University Law Review, 65, 1. https://aulawreview.org/blog/us-tax-imperialism-in-puerto-rico/
Dieterle, D. A. (2020). Taxation. Greenwood.
Duties and taxes to constitute fund for benefit of Puerto Rico; ports of entry, 48 U.S.C. § 740 (2023). https://uscode.house.gov/view.xhtml?req=granuleid:USC-prelim-title48-section740&num=0&edition=prelim
EFE. (2022, 30 de octubre). La SIP alerta sobre falta de transparencia en el Gobierno de Puerto Rico. Sociedad Suiza de Radio y Televisión SRG SSR. https://www.swissinfo.ch/spa/la-sip-alerta-sobre-falta-de-transparencia-en-el-gobierno-de-puerto-rico/48017458
Financial Oversight and Management Board for Puerto Rico. (2024, June). 2024 fiscal plan for Puerto Rico. Restoring growth and prosperity. https://juntasupervision.pr.gov/planes-fiscales/
García López, J. G. (2022). Reformas contributivas en Puerto Rico: trasfondo, impacto y alcance, 1898-2020. Publicaciones Puertorriqueñas.
Gómez-Barroso, J. L. (2022). Public economics: A concise introduction. Routledge.
Habiger, S. (Rev.). (2023, February 20). Taxation without representation: Definition & example. https://www.freshbooks.com/glossary/tax/taxation-without-representation?srsltid=AfmBOorVs1rBi7JP1k7SuAilFJAn1YBDPa-GO8ONHCTqVEta07Bt-73o
Hatch, O. (2020, January 25). ‘Decepcionado’ con la falta de transparencia uno de los padres de PROMESA. Youtube. https://www.youtube.com/watch?v=hZVUZEFkC5M
Hlushchenko, Y., Chernenko, N., Korohodova, O., Moiseienko, T., & Moskvychova, K. (2024). Evaluating the influence of taxation levels on the degree of economic freedom of countries. Journal of Economy Culture and Society, (69), 66–76. https://dergipark.org.tr/en/download/article-file/3408368
Insurance Code, Act No. 77 of June 19, 1957, as amended (1957 & rev. 2025). https://www.ocs.pr.gov/en-us/asuntos-legales/codigo-de-seguros
Internal Revenue Code, 26 U.S.C. § 933: Income from sources within Puerto Rico (1954 & rev. 2023). https://uscode.house.gov/view.xhtml?req=Puerto+Rico&f=treesort&fq=true&num=745&hl=true&edition=prelim&granuleId=USC-prelim-title26-section933
Internal Revenue Code, 26 U.S.C. § 2209: Certain residents of possessions considered nonresidents not citizens of the United States (1960). https://uscode.house.gov/view.xhtml?req=granuleid:USC-prelim-title26-section2209&num=0&edition=prelim
Internal Revenue Code, 26 U.S.C. § 3101: Rate of tax (2023a). https://uscode.house.gov/view.xhtml?req=(title:26%20section:3101%20edition:prelim)#:~:text=(a)%20Old-age%2C,in%20section%203121(b))
Internal Revenue Code, 26 U.S.C. § 3121: Definitions (2023b). https://uscode.house.gov/view.xhtml?req=granuleid:USC-prelim-title26-section3121&num=0&edition=prelim
Internal Revenue Code, 26 U.S.C. § 4261: Imposition of tax (2023c). https://uscode.house.gov/view.xhtml?req=(title:26%20section:4261%20edition:prelim
Internal Revenue Service. (2019). Form706-NA. United States estate (and generation-skipping transfer) tax return estate of nonresident not a citizen of the United States. https://www.irs.gov/pub/irs-pdf/f706na.pdf
Internal Revenue Service. (2024, November 25). Self-employment tax (Social Security and Medicare taxes). https://www.irs.gov/businesses/small-businesses-self-employed/self-employment-tax-social-security-and-medicare-taxes
Internal Revenue Service. (2025a, April 3). Earned Income Tax Credit (EITC). https://www.irs.gov/credits-deductions/individuals/earned-income-tax-credit-eitc
Internal Revenue Service. (2025b, May 22). Estate tax for nonresidents not citizens of the United States. https://www.irs.gov/businesses/small-businesses-self-employed/estate-tax-for-nonresidents-not-citizens-of-the-united-states
Internal Revenue Service. (2025c, May 29). SOI Tax Stats - Gross collections by type of tax and state - IRS Data Book Table 5. https://www.irs.gov/statistics/soi-tax-stats-gross-collections-by-type-of-tax-and-state-irs-data-book-table-5
Joffe, M. D., & Martinez, J. (2016). Origins of the Puerto Rico fiscal crisis. Mercatus Research.
Johns, J. (2025, May 13). State and local tax collections per capita by state, 2025. https://taxfoundation.org/data/all/state/state-local-tax-collections-per-capita/
Junta de Planificación. (2023, enero). Ingreso y producto 2023. https://jp.pr.gov/ingreso-y-producto-2/
Junta de Planificación. (2024, enero). Informe económico al gobernador. Apéndice estadístico 2023. https://jp.pr.gov/apendice-estadistico-del-informe-economico-a-la-gobernador/
Junta de Planificación de Puerto Rico. (1996). Manual de documentación general. https://jp.pr.gov/wp-content/uploads/2021/09/Manual-Documentacion-JP-jul-1994.pdf
Karakotsios, A., Katrakilidis, C., Dimitriadis, D., & Christoforidis, T. (2020). Examining the relationship between income inequality, taxation and economic freedom: A panel cointegration approach. Economics and Business Letters, 9(3), 206‒215. https://doi.org/10.17811/ebl.9.3.2020.206-215
Ley de la Justicia Contributiva de 2006, Ley Núm. 117 de 4 de julio de 2006 (2006). https://bvirtualogp.pr.gov/ogp/Bvirtual/leyesreferencia/PDF/2/0117-2006.pdf
Ley del Departamento de Seguridad Pública de Puerto Rico, Ley Núm. 20 de 10 de abril de 2017, según enmendada (2017). https://docs.pr.gov/files/911/Documentos/Leyes/20-2017.pdf
Ley del Seguro para Chóferes y otros Empleados, 29 LPRA § 691 (1950 & rev. 2019). https://trabajo.pr.gov/docs/Leyes/Ley_428-1950,_Ley_del_Seguro_para_Choferes_y_otros_Empleados.pdf
Ley del Sistema de Compensaciones por Accidentes del Trabajo, Ley 45 de 18 de abril de 1935, según enmendada (1935 & rev. 2024). https://bvirtualogp.pr.gov/ogp/Bvirtual/leyesreferencia/PDF/Trabajo/45-1935/45-1935.pdf
Ley de Seguridad de Empleo de Puerto Rico, Ley Núm. 74 de 21 de junio de 1956, según enmendada (1956 & rev. 2025). https://www.trabajo.pr.gov/docs/Division%20de%20Apelaciones/Ley%2074-1956,%20Ley%20de%20Seguridad%20de%20Empleo%20de%20Puerto%20Rico%20Revisada%20enero%202025.pdf
Ley de Telecomunicaciones de Puerto Rico de 1996, Ley Núm. 213 de 12 de septiembre de 1996, según enmendada (1996). https://bvirtualogp.pr.gov/ogp/Bvirtual/LeyesOrganicas/PDF/213-1996.pdf
Ley de Transparencia y Procedimiento Expedito para el Acceso a la Información Pública, Ley Núm. 141 de 1 de agosto de 2019 (2019). https://www.justicia.pr.gov/secretarias-y-oficinas/ley-de-transparencia-y-procedimiento-expedito-para-el-acceso-a-la-informacion-publica/
Ley Núm. 41 de 29 de agosto de 2021 (2021). https://www.lexjuris.com/lexlex/Leyes2021/lexl2021041.htm
Ley Núm. 52 de 30 de junio de 2022 (2022). https://bvirtualogp.pr.gov/ogp/Bvirtual/leyesreferencia/PDF/2020/0052-2022.pdf
Ley para Establecer un Impuesto a las Corporaciones Foráneas, Ley Núm. 154 de 25 de octubre de 2010 (2010 & rev. 2021) https://bvirtualogp.pr.gov/ogp/Bvirtual/leyesreferencia/PDF/154-2010.pdf
Ley para Imponer un Derecho de Importación al Café Extranjero que para Uso, Consumo y Venta se Importe en Puerto Rico, Ley Núm. 77 de 5 de mayo de 1931, según enmendada (1931 & rev. 2024). https://bvirtualogp.pr.gov/ogp/Bvirtual/leyesreferencia/PDF/Agricultura/77-1931.pdf
Lindert, P. H. (2004). Growing public: Social spending and economic growth since the eighteenth century. Cambridge University Press.
Loughead. K. (2025, January 7). Americans moved to low-tax states in 2024. Tax Foundation. https://taxfoundation.org/data/all/state/americans-moving-to-states/
Mandal, A. (2025, January 21). State Corporate Income Tax Rates and Brackets, 2025. Tax Foundation. https://taxfoundation.org/data/all/state/state-corporate-income-tax-rates-brackets/#:~:text=South%20Dakota%20and%20Wyoming%20are,%2C%20leading%20to%20tax%20pyramiding.%20
Mares, I., & Queralt, D. (2015). The non-democratic origins of income taxation. Comparative Political Studies, 48(14), 1974‒2009. https://www.researchgate.net/profile/Didac-Queralt-2/publication/282803704_The_Non-Democratic_Origins_of_Income_Taxation/links/561fd79208ae70315b5523cc/The-Non-Democratic-Origins-of-Income-Taxation.pdf
Mascagni, G. (2018). From the lab to the field: A review of tax experiments. Journal of Economic Surveys, 32(2), 273‒301. https://onlinelibrary.wiley.com/doi/pdfdirect/10.1111/joes.12201
Masud, A., & Gambo, E. (2019). Tax rate and tax compliance in Africa. European Journal of Accounting Auditing and Finance Research. 2(3), 4–10. https://doi.org/10.6007/IJARAFMS/v7-i1/2692
Moretti, E., & Wilson, D. J. (2017). The effect of state taxes on the geographical location of top earners: Evidence from star scientists. American Economic Review, 107(7), 1858‒1903.
Morris, D. (2020). Taxation in utopia. Required sacrifice and the general welfare. Sunny Press.
Moslimani, M., Noe-Bustamante, L., & Shah, S. (2023, August 16). Facts on Hispanics of Puerto Rican origin in the United States, 2021. Pew Research Center. https://www.pewresearch.org/race-and-ethnicity/fact-sheet/us-hispanics-facts-on-puerto-rican-origin-latinos/
Munongo, S., Akanbi, O. A., & Robinson, Z. (2017). Do tax incentives matter for investment? A literature review. Business and Economic Horizons, 13(2), 152‒168.
Normas para aumentar el derecho sobre café importado al Estado Libre Asociado de Puerto Rico, Núm. 4663 (1992). app.estado.gobierno.pr/ReglamentosOnLine/Reglamentos/4663.pdf
Oficina del Contralor de Puerto Rico. (2023, 18 de diciembre). Encuesta sobre percepción de la ciudadanía con relación a la transparencia en el sector público y el acceso a la información. Informe de Resultados. https://www.ocpr.gov.pr/wp-content/uploads/2024/02/Informe-de-Resultados-Encuesta-de-la-OCPR-sobre-Transparencia-y-Acceso-a-la-Informacion-final.pdf
Office of the Chairwoman. (2024, August 8). The Universal Service Fund: How it impacts Puerto Rico [Press release]. https://docs.fcc.gov/public/attachments/DOC-404605A1.pdf
Oficina de Presupuesto de la Asamblea Legislativa de Puerto Rico. (2024, 12 de abril). Informe especial: análisis del efecto económico y fiscal de la migración neta en Puerto Rico del 2008-2022. https://www.opal.pr.gov/informe-especial/migracion
Ordeanza Núm. 20, Ses. Ord. Serie 2024-2025 (2025). https://acrobat.adobe.com/id/urn:aaid:sc:US:ec0f65da-e797-4769-971b-d7f1d3e007f7
Organisation for Economic Co-operation and Development. (2010, November 3). Tax policy reform and economic growth. OECD Publishing. https://doi.org/10.1787/9789264091085-en.
Organisation for Economic Co-operation and Development. (2023). Revenue statistics interpretative guide. Annex A. The OECD classification of taxes and interpretative guide. https://www.oecd.org/content/dam/oecd/en/topics/policy-sub-issues/global-tax-revenues/oecd-classification-taxes-interpretative-guide.pdf
Organisation for Economic Co-operation and Development. (2024, November 21). Revenue statistics 2024: Health taxes in OECD countries. OECD Publishing. https://doi.org/10.1787/c87a3da5-en.
Pérez, S. M. (2025, 20 de junio). CRIM reanuda el cobro de impuestos por tasación virtual. El Nuevo Día. https://www.elnuevodia.com/negocios/bienes-raices/notas/crim-reanuda-el-cobro-de-impuestos-por-tasacion-virtual/
Planning Board. (2024, January). Table 34 - Number of employed persons in establishments by major industrial sector: fiscal years. Economic report to the governor 2023 and to the legislative assembly statistical appendix. https://jp.pr.gov/wp-content/uploads/2024/05/Apendice-Estadistico-2023.pdf
Puerto Rico Incentives Code, Act No. 60 of July 1, 2019, as amended (2019 & rev. 2024). https://bvirtualogp.pr.gov/ogp/Bvirtual/leyesreferencia/PDF/2-ingles/60-2019.pdf
Puerto Rico Internal Revenue Code of 2011, Act No. 1 of January 31, 2011, as amended (2011 & rev. 2025). https://bvirtualogp.pr.gov/ogp/Bvirtual/leyesreferencia/PDF/2-ingles/1-2011.pdf
Reid, T. R. (2017). A fine mess. A global quest for a simpler, fairer, and more efficient tax system. Penguin Press.
Reglamento de Apuestas Deportivas de Puerto Rico, Núm. 9316 de 20 de octubre de 2021 (2021). https://docs.pr.gov/files/ComJuegos/Negociado%20Apuestas%20Deportivas/Reglamentos/9316%20REGLAMENTO%20DE%20APUESTAS%20DEPORTIVAS%20DE%20PUERTO%20RICO.pdf
Reglamento Tarifario para el Manejo y Disposición de Neumáticos, Núm. 8096 de 2 de noviembre de 2011. (2011). https://transicion2016.pr.gov/Agencias/014/Informe%20de%20Reglamento%20y%20Normas/8096.pdf
Ríos, E. R. (2007, September 18). Estimating revenues Puerto Rico new sales and use tax [Conference presentation]. FTA 2007 Revenue Estimation and Tax Research Conference, Raleigh, NC. https://taxadmin.org/wp-content/uploads/resources/07rev_est/edwin.pdf
Rudenko, V., Pohrishchuk, H., Moskvichova, O., & Hryhoruk, I. (2023). The impact of preferential taxation on the stimulation of investment processes in Ukraine in the context of the experience of EU member states. International Journal of Environmental Engineering and Development, 1, 62‒76. https://doi.org/10.37394/232033.2023.1.8
Schuhmann, R., & Jensen, J. (2022). Time for a significant reimagining of government in Wyoming? California Journal of Politics and Policy, 14(1). https://doi.org/10.5070/P2cjpp14157319
Sherman, M. (2025). Supreme Court OKs fee that subsidizes phone, internet services in schools, libraries and rural areas. Associate Press. https://apnews.com/article/supreme-court-telecommunications-fee-internet-phone-bill-d02052fc7c4617eb0dd4f27cac680865
Slemrod, J., & Bakija, J. (2017). Taxing ourselves: A citizen’s guide to the debate over taxes. MIT press.
Stansel, D., Torra, J. Mitchell, M., & Carrión-Tavárez, Á. Economic Freedom of North America 2024. Fraser Institute. https://doi.org/10.53095/88975023
Stantcheva, S. (2021). Understanding tax policy: How do people reason? The Quarterly Journal of Economics, 136(4), 2309‒2369.
Stewart, J. (2024, July 29). Discrepancies and the need for transparency in US tariff and excise collections on imports into Puerto Rico. Linkedin. https://www.linkedin.com/pulse/discrepancies-lack-transparency-us-tariff-excise-imports-john-stewart-8eszf/
Stewart, J. R. (2025, 19 de junio). Falta de transparencia en aranceles para Puerto Rico. El Nuevo Día. https://www.elnuevodia.com/opinion/punto-de-vista/falta-de-transparencia-en-aranceles-para-puerto-rico/
St. Germain, E. (s.f.). No taxation without representation–meaning, origins & more. https://www.americanrevolution.org/no-taxation-without-representation/
Telecommunications Act of 1996, 47 U.S.C. § 254: Universal Service (1996). https://www.govinfo.gov/content/pkg/BILLS-104s652enr/pdf/BILLS-104s652enr.pdf
United States Census Bureau (2022). Table 1. State and local government finances by level of government and by state: 2022. https://www.census.gov/data/datasets/2022/econ/local/public-use-datasets.html
United States Census Bureau. (2024a). Annual estimates of the resident population for the United States, regions, states, District of Columbia, and Puerto Rico: April 1, 2020 to July 1, 2024. https://www.census.gov/data/tables/time-series/demo/popest/2020s-national-total.html
United States Census Bureau. (2024b). Historical poverty tables: People and families - 1959 to 2023. https://www.census.gov/data/tables/time-series/demo/income-poverty/historical-poverty-people.html
United States Census Bureau. (2024c, July 31). State Tax Collections Per Capita. https://www.census.gov/library/visualizations/interactive/state-tax-collections-per-capita.html
United States Department of Commerce. (1991, August). Survey of current business. https://www.bea.gov/resources/methodologies/gdp-as-measure-us-production
U.S. Customs and Border Protection. (2021, February 5). CBP year in review: Caribbean operations reach important milestones to secure and facilitate travel and trade. https://www.cbp.gov/newsroom/local-media-release/cbp-year-review-caribbean-operations-reach-important-milestones-secure
U.S. Government Accountability Office. (2025, June). U.S. territories public debt and economic outlook—2025 Update. https://files.gao.gov/reports/GAO-25-107560/index.html?_gl=1*ch1jju*_ga*NjIwNzIwNTc1LjE3NTEyOTI1NjE.*_ga_V393SNS3SR*czE3NTEyOTQ0MDkkbzIkZzAkdDE3NTEyOTQ0MDkkajYwJGwwJGgw
Vargas-Ramos, C., Méndez Lacomba, J., & Soldevilla-Irizarry, J. (2024, December). ¿No pagan taxes? Overview of federal revenue-raising in Puerto Rico, 2024. https://academicworks.cuny.edu/cpr_pubs/33/
von Mises, L. (1949). Human action a treatise on economics. Ludwig von Mises Institute. https://jeffersonamericas.org/wp-content/uploads/2020/07/La-accion-Humana.pdf
White, E. D., & Brown, H. B. (1901, May 27). Downes v. Bidwell. https://teachingamericanhistory.org/document/downes-v-bidwell/
White, J. (2010). Tax compliance benefits and opportunities to mitigate costs on third parties of miscellaneous income reporting requirements. International Journal of Business and Accounting. 2(6), pp. 45–89. https://doi.org/10.6007/IJARAFMS/v7-i1/2999
15. Sources Consulted
Castañer Martínez, J. A. (2023, 4 de agosto). ¿PIB o PNB? Sin comillas. https://sincomillas.com/pib-o-pnb/#:~:text=2%20Comments&text=Lo%20correcto%20es%20usar%20el,PR%20no%20controla!!!!&text=Por%20fin%20se%20destapó%20uno,y%20otros%20se%20siguen%20yendo
Collins, S. M., Bosworth, B. P., & Soto-Class, M. A. (Eds.). (2006). Restoring growth in Puerto Rico: Overview and policy options. Brookings Institution Press. http://www.jstor.org/stable/10.7864/j.ctt1287bk3
Colón Morera, J. J., Ruiz Mercado, A. L., Segarra Alméstica, E. V., Rodríguez Castro, A., Lara Fontánez, J., Luciano Montalvo, I., & Alegría Ortega, I. E. (2016, 14 de marzo). Efectos sobre la competitividad de Puerto Rico de posibles cambios en la Ley 600 informe final (E. Otero Figueroa, Ed.). Universidad de Puerto Rico, Recinto de Río Piedras. https://mail.economia.uprrp.edu/old/INFORMEFinalEstudioLey%20600.pdf
Cordero, G. (2013, 29 de octubre). Evaluarán aumentar impuesto a café importado. Primera Hora. https://www.primerahora.com/noticias/gobierno-politica/notas/evaluaran-aumentar-impuesto-a-cafe-importado/
Cornia, G. C., & Walters, L. C. (2019, March). Property taxes in Puerto Rico: Assessment and recommendations [Technical report]. Brigham Young University. https://www.researchgate.net/publication/332229873_Property_Taxes_in_Puerto_Rico_Assessment_and_Recommendations
Corporación del Fondo del Seguro del Estado. (2024, [30 de junio]). Manual de clasificaciones de oficios e industrias y tipos de seguros. https://www.cfse.pr.gov/wp-content/uploads/2024/06/Manual-de-Clasificaciones-de-Oficios-e-Industrias-y-Tipos-de-Seguros-2024-2025-completo-para-portal-1.pdf
Departamento de Hacienda. (2023, julio 11). Departamento de Hacienda informa $12,597.6 millones en recaudos totales para el año fiscal 2023 [Comunicado de prensa]. https://hacienda.pr.gov/sobre-hacienda/sala-de-prensa-virtual/comunicados-de-prensa/departamento-de-hacienda-informa-125976-millones-en-recaudos-totales-para-el-ano-fiscal-2023
Department of the Treasury. (2023, June). Treasury single account (TSA) FY 2023 cash flow for the month of June FY23 and Q4 FY23. https://hacienda.pr.gov/sites/default/files/monthly_tsa_fy_2023_-_cash_flow_for_the_month_of_june_2023_0.pdf
Dietz, J. L. (1986). Economic history of Puerto Rico: Institutional change and capitalist development. Princeton University Press.
Enmienda a la Ley de Beneficios por Incapacidad Temporal, Ley Núm. 159 de 1998 (1998) https://www.lexjuris.com/LEXLEX/LEY1998/LEX98159.htm
Federal Aviation Administration. (2022). Current aviation excise tax structure and rates. https://www.faa.gov/budget/aatf/current-aviation-excise-tax-structure-and-rates
Federal Unemployment Tax Act, 26 U.S.C. § 3301 et seq. (1939 & rev. 2018). https://uscode.house.gov/view.xhtml?path=/prelim@title26/subtitleC/chapter23&edition=prelim
Financial Oversight and Management Board for Puerto Rico. (2024, June 30). Letter to governor Pierluisi and the legislature certifying the FY2025 commonwealth budget. https://docs.pr.gov/files/OGP/PresupuestoAprobado_2024-2025/OtrosDocumentos/FOMB-Letter-Governor_Legislature_CW_FY25_Consolidated_Budget_Resolution_June_30-2024.pdf
Junta de Supervisión y Administración Financiera para Puerto Rico. (2024, 14 de junio). El camino por delante: los cimientos de las finanzas municipales. Plan fiscal para el Centro de Recaudación de Ingresos Municipales, años fiscales 2025 a 2029. https://drive.google.com/file/d/1vFFlKcrybLb8o0DJu4Gx9TehS3jfBUUo/view?usp=embed_facebook
Mankiw, N. G., Weinzierl, M., & Yagan, D. (2009). Optimal taxation in theory and practice. Journal of Political Economy, 23(4), 147‒174. https://doi.org/10.1257/jep.23.4.147
Montalbán Ríos, E. (2023, 3 de febrero). Agricultura asegura que aduana federal ha retenido el pago de arancel del café desde el 2014. El Vocero. https://www.elvocero.com/economia/otros/agricultura-asegura-que-aduana-federal-ha-retenido-el-pago-de-arancel-del-caf-desde-el/article_d30de318-a35e-11ed-a885-33aac0c4f134.html#google_vignette
Oficina de Presupuesto de la Asamblea Legislativa. (2024, 6 de junio). Informe especial: ingresos y gastos del fondo general (AF 2000-2022). https://www.opal.pr.gov/informe-especial/ingresos-y-gastos-del-fondo-general-af-2000-2022
Organisation for Economic Co-operation and Development. (2022, April 27). Revenue statistics in Latin America and the Caribbean 2022. OECD Publishing. https://doi.org/10.1787/58a2dc35-en-es.
Ríos, E. R. (2001). Estructura contributiva y recursos fiscales de Puerto Rico. Ceteris Paribus, 12, 1‒26. https://www.uprm.edu/ceterisparibus/wp-content/uploads/sites/242/2022/04/estructura-contributiva-y-recursos-fiscales-de-puerto-rico.pdf
Taxpayer Relief Act of 1997, Public Law 105-34 (1997). https://www.congress.gov/105/plaws/publ34/PLAW-105publ34.pdf
Walcak, J. (2025, February 4). State and local sales tax rates, 2024. Tax Foundation. https://taxfoundation.org/data/all/state/2024-sales-taxes/
World Population Review. (2025, June 2). Car sales tax by state 2025.
https://worldpopulationreview.com/state-rankings/car-sales-tax-by-state#sources
Appendix:
Puerto Rico Tax Database
Puerto Rico’s tax system comprises a wide array of taxes levied on various economic activities. Some taxes are administered and collected by the central government, while others fall under the jurisdiction of local (municipal) governments. This appendix is intended to serve as an organized and integrated repository of the principal taxes in effect on the Island, as well as a tool to support comparisons with other jurisdictions, economic studies, and analyses of Puerto Rico’s tax system. It is expected that this resource will facilitate access to key information for researchers, public officials, and the general public.
The criterion used to classify taxes in Table A1, Puerto Rico Tax Index, is the base upon which the tribute is imposed. For example, the individual income tax applies to various sources of personal income; the corporate income tax, to profits; the consumption tax, to the acquisition of goods and services; and the property tax, to the ownership of real estate. Other classification criteria include distinctions such as direct versus indirect taxes, or progressive, regressive, or proportional taxes. For this classification, the Revenue Statistics Interpretative Guide. Annex A. The OECD Classification of Taxes and Interpretative Guide was used as a reference.
Table A2, Puerto Rico Tax Reference Guide, outlines the types of taxes and applicable rates. The taxes included are drawn from the Puerto Rico Internal Revenue Code of 2011, the Código Municipal de Puerto Rico (Puerto Rico Municipal Code), and other governmental sources from Puerto Rico and the United States. The table presents general tax provisions, not special provisions that contain limitations or exceptions; therefore, taxes established under the Puerto Rico Incentives Code are excluded, as they are essentially the same taxes but subject to preferential rates. The information provided should not be used for tax filing purposes; for that, the applicable legislation and official tax forms must be consulted.
This “Puerto Rico Tax Database” was developed as part of the study Taxes in Puerto Rico: Structure, Tax Burden, and Comparison with the United States. The research examines the categories and characteristics of the tax system; analyzes collections for fiscal year 2023; estimates the effective tax burden on residents, as well as the per capita tax in Puerto Rico; and compares tax levels with those of the 50 states. This appendix complements the main report and is conceived and designed as a dynamic resource, subject to updates and expansion, with the aim of serving as an accessible and useful source of information for economic and fiscal analysis of Puerto Rico.


Ángel Carrión-Tavárez is Director of Research and Policy at the Institute for Economic Liberty and Academic Director of the Escuela Hispánica. He holds a bachelor’s degree in Sociology from the University of Puerto Rico, a master’s degree in Linguistics from California State University, and a doctorate in Integration and Economic and Territorial Development from Universidad de León (Spain). He founded and edited Panorama 21, a journal of economics and public policy published in English, Spanish, and Portuguese, and served as Managing Editor of the weekly Caribbean Business. He was Editor-in-Chief and Chair of the Editorial Board of the peer-reviewed journal Fórum Empresarial. He has also served as Academic Coordinator of the Certificate in Editing and Publishing Arts, professor of regional and business geography, and Director of the Center for Business Research at the University of Puerto Rico. Over the course of his career, he has been a guest lecturer at universities in Germany, Spain, the United States, Mexico, Colombia, Brazil, Peru, and Chile, and has participated as a speaker and moderator in numerous international academic forums. His recent research has appeared in reports such as Doing Business North America 2022 (published by the Center for the Study of Economic Liberty at Arizona State University) and Economic Freedom of North America 2022, 2023, and 2024 (published by the Fraser Institute). He is the author of more than 200 works across various disciplines, many of which have been recognized by academic and cultural institutions and featured in media outlets including The Wall Street Journal, Newsweek, Forbes, National Public Radio, Univision, and Radio France Internationale.
Edwin R. Ríos holds bachelor’s and master’s degrees in Economics from the University of Puerto Rico. He served as Assistant Secretary for Economic and Financial Affairs at the Puerto Rico Department of Treasury from 2005 to 2019. In that role, he led the office responsible for advising the Secretary of Treasury on fiscal and tax policy and served as lead economist in the evaluation and analysis of multiple tax reform proposals and fiscal legislation. In 2016, he participated in meetings at the Office of Tax Analysis of the U.S. Department of the Treasury, focused on the development of simulation and revenue forecasting models applicable to Puerto Rico. He also led the preparation of the Island’s first official report on tax expenditures, published in 2017. Since 2019, he has worked as a private-sector economist, providing consulting services on fiscal and economic matters to entities such as the House Finance Committee, the Legislative Assembly’s Budget Office, and the Institute for Economic Liberty. He served as President of the Puerto Rico Economists Association and represented the organization as a member of the Governor’s Advisory Group for Tax System Simplification. He has attended fiscal policy conferences in Italy, Argentina, and Chile, and participated in multiple forums of the Federation of Tax Administrators in the United States. In addition, he has taught economics courses at the Interamerican University of Puerto Rico and delivered seminars on public policy and tax reform at the Puerto Rico Society of Certified Public Accountants.
Carrión-Tavárez, Á., & Ríos, E. R. (2025, October). Taxes in Puerto Rico: Structure, Tax Burden, and Comparison with the United States. Institute for Economic Liberty. https://doi.org/10.53095/13584019
[1] Since ancient times, various religious systems have also established taxation mechanisms linked to devotional, normative, or social practices. In Hinduism and Buddhism, in-kind tributes of time and talents were collected. In the Judeo-Christian tradition, the tithe was instituted—an in-kind tribute equivalent to one-tenth of production. In Islam, the tax known as khums represents one-twentieth of certain types of acquired wealth or production.
[2] After all, we can’t have more government spending without raising sufficient taxes to pay for it (Slemrod & Bakija, 2017).
[3] The constant succession of revisions and additions to tax codes and laws exacerbates the problem of complexity. In the United States, Commerce Clearing House, a publisher that monitors changes in tax legislation, has estimated that approximately 420 significant modifications to the tax code occur each year, many of which require new forms, new rules, and complete instruction manuals that taxpayers must follow (Reid, 2017, pp. 212–213). This multiplicity of amendments and code revisions has also occurred in Puerto Rico.
[4] Puerto Rico has ranked 51st in the U.S. “Subnational Index” since its inclusion in 2022 in the Economic Freedom of North America report published by the Fraser Institute. In the most recent edition, the Island’s score was 2.13. The lowest-scoring state was New York, with 4.25—nearly double Puerto Rico’s score—followed by California (4.44), Hawaii (4.68), and New Mexico (4.81). Scores are based on data from fiscal year 2022 (Stansel et al., 2024).
[5] This refers to Doing Business North America 2022 Report by the Center for the Study of Economic Liberty at Arizona State University. It measures the ease of doing business in 83 major U.S. cities. In the study, San Juan ranks last with 42.21, preceded by Los Angeles (56.29), New York (61.39), Newark (61.50), and Fresno (61.53). The report’s scores are based on data from calendar years 2019 and 2020. The study’s components and indicators are 2% federal, 70% state, 24% local, and 4% county; consequently, San Juan’s results can be considered a reflection of Puerto Rico (Carrión-Tavárez, 2023).
[6] One of the findings of García López’s work on this subject was precisely that tax reforms have not been comprehensive enough to be effective and move the system toward a true transformation (2022, p. 158).
[7] In this report, the terms tax burden and fiscal burden are used interchangeably to refer to the ratio between taxes collected in a given period and the monetary value of a country’s total product (Celikay, 2020).
[8] The term “local,” whether singular or plural, is used in this report to refer to municipalities in Puerto Rico and to counties, municipalities, and cities in the United States.
[9] Fiscal years in Puerto Rico run from July through June.
[10] These fiscal years were used because they are the most recent for which complete data on tax revenues are available in each jurisdiction.
[11] The sources include the Insurance Code (1957/2025); the Internal Revenue Code (2023a); the Ley Núm. 52 (2022); the Ley de Seguridad de Empleo de Puerto Rico (1956/2025); the Ley del Impuesto sobre el Canon por Ocupación de Habitación del Estado Libre Asociado de Puerto Rico (2003/2024); the Ley del Seguro para Chóferes y otros Empleados (1950/2019); the Ley del Sistema de Compensaciones por Accidentes del Trabajo (1935/2024); the Ley para Imponer un Derecho de Importación al Café Extranjero que para Uso, Consumo y Venta se Importe en Puerto Rico (1931/2024); and the Reglamento Tarifario para el Manejo y Disposición de Neumáticos (2011). Also consulted were the Modelo SC 2225 and Form AS 2915.1 tax forms (Departamento de Hacienda, 2015 and 2022); the Tipos contributivos año fiscal 2024–2025 (CRIM, 2025); the Sinot website (Departamento del Trabajo y Recursos Humanos, 2021); and the Revenue Statistics Interpretative Guide. Annex A. The OECD Classification of Taxes and Interpretative Guide (OECD, 2023), used as a reference for the classification of taxes in the appendix of this report.
[12] The OECD is an international cooperation body composed of 38 member countries around the world, established to coordinate their economic and social policies.
[13] The OECD’s criteria and codes provide conceptual clarity and technical precision regarding the various types of taxes that make up tax systems. They are particularly relevant for comparative purposes across jurisdictions, as they constitute an international standard.
[14] Federal taxes paid by individuals in Puerto Rico consist primarily of contributions to Social Security.
[15] “Generally speaking, the system is progressive if the wealthiest pay the most and regressive if the opposite is true or if people with different incomes pay the same. This distinction can also be made for specific taxes”; for example, a value added tax or sales tax is regressive because a high-income person and someone living in poverty “pay the same tax on a tin of sardines” (Gómez-Barroso, 2022, p. 130).
[16] This information is available in Table A2 Puerto Rico Tax Reference Guide in the appendix.
[17] For Burman and Slemrod, this distinction is less important, because “the person or business entity that writes the check doesn’t necessarily bear the burden of the tax. Consider the corporate income tax. Many people like the corporate income tax because they think businesses should pay taxes, not people. But the fact that the business remits the tax doesn’t really tell you whose bottom line is affected by it.” The tax may impact “the company’s shareholders or the workers. The tax could be passed through to customers in the form of higher prices. Or it could be some combination of all the above. The fact that the corporation “pays” the tax doesn’t tell you much” (2020, p. 23).
[18] All monetary amounts are presented in millions of dollars and rounded to the nearest whole number unless otherwise indicated.
[19] The tax rates for real and personal property are published by the CRIM (2025).
[20] This is commonly known in Puerto Rico as the inventory tax, as it levies merchandise held in storage that has not yet been sold by businesses.
[21] Subtitle B of the Puerto Rico Internal Revenue Code of 2011 addresses the topic of estate and gift taxes.
[22] Information on municipal license tax (patente) rates and their distribution across real and personal property is available on the website of the Colegio de Contadores Públicos Autorizados de Puerto Rico (2025).
[23] The OECD uses the terms “selective taxes” and “taxes on specific services.” In this document, the terms “taxes on goods” and “tax on certain transactions” are used, in accordance with the Puerto Rico Internal Revenue Code of 2011 (2011/2025). “Taxes on goods” refer to excise-type levies imposed on the sale or consumption of specific products, whereas “tax on certain transactions” encompass levies applied to non-tangible exchanges. Chapter 4 of the Puerto Rico Internal Revenue Code, “Tax on Certain Transactions,” includes only the tax on horse racing betting.
[24] According to Dieterle, another “form of taxation that is legal and completely voluntary is state lotteries. Since the money that remains after the winnings are paid out goes to the state, or states, conducting lotteries is a form of taxation—the most voluntary form of taxation. Lotteries are also a form of gambling. In some states, specifically Nevada, gambling is a major source of the state’s revenue (as well as all the sales taxes collected from the tourism industry). Gambling, like lotteries, is a totally voluntary activity. You’re not breaking the law if you choose to not participate in a lottery” (2020, p. 10). The OECD does not classify lotteries as a form of taxation; therefore, lottery revenues in Puerto Rico were not included in this report.
[25] In response to this protectionist measure in favor of Puerto Rican coffee growers, the Legislative Assembly of Puerto Rico approved the Ley para Imponer un Derecho de Importación al Café Extranjero que, para uso, consumo y venta, se importe en Puerto Rico (1931/2024).
[26] The current tariff was established in the Normas para Aumentar el Derecho sobre Café Importado al Estado Libre Asociado de Puerto Rico (1992).
[27] A recent example of these taxes is Ordenanza Número 20 (2025) of the Municipality of Isabela, “To establish a charge on all transactions involving the purchase and sale of high-value real property located in the Municipality of Isabela, whose sale price is one million dollars or more, and of real property to be used as a second home exceeding three hundred thousand ($300,000.00) dollars.” This type of tax or charge also exists in other municipalities.
[28] These charges were established by the Ley del Departamento de Seguridad Pública de Puerto Rico (2017) and the Ley de Telecomunicaciones de Puerto Rico de 1996 (1996).
[29] Although the Ley de Transparencia y Procedimiento Expedito para el Acceso a la Información Pública (2019) establishes mechanisms to ensure citizens’ access to public interest information, a significant lack of transparency persists in Puerto Rico. Various sources have documented the difficulty in obtaining reliable data (EFE, 2022; Hatch, 2020; Joffe & Martinez, 2016; Oficina del Contralor de Puerto Rico, 2023; Stewart, 2025), as well as the reluctance of some officials to disclose duly requested information. This issue repeatedly surfaced during the development of this study, limiting access to relevant data for the fiscal analysis.
[30] For information on this subject, see the Puerto Rico Incentives Code (2019/2024).
[31] Also, they can lead to the loss of budget revenues, which could be used more productively. Therefore, to eliminate a significant number of shortcomings and contradictory consequences of the use of tax incentives, it is necessary to take measures for their effective management (Rudenko et al., 2023, p. 69).
[32] James Otis Jr., a lawyer and politician from Massachusetts, “is most closely linked with this slogan, although he may not have been the first to use it. He campaigned heavily against taxation without representation. In 1764, Otis wrote “…the very act of taxing, exercised over those who are not represented, appears to me to be depriving them of one of their most essential rights, as freemen; and if continued, seems to be in effect an entire disfranchisement of every civil right”” (St. Germain, n.d.).
[33] In the case Downes v. Bidwell, the United States Supreme Court ruled that “Puerto Rico is a territory appurtenant and belonging to the United States, but not a part of the United States” (White & Brown, 1901), a situation that remains in effect to this day.
[34] Dick’s (2015) article “develops a novel theory of U.S. tax imperialism in Puerto Rico, chronicling the sundry ways in which the United States has used tax laws to exert economic dominance over its less developed island colony. During the colonial period, U.S. officials wrote and revised Puerto Rican tax laws to serve U.S. economic interests. In more recent years, U.S. tax laws have disadvantaged Puerto Ricans, who still lack voting rights and full democratic representation in Congress” (Dick, 2015, p. 1).
[35] Section 933 of the United States Internal Revenue Code provides that income derived by an individual from sources within Puerto Rico is exempt from federal income tax, provided the individual qualifies as a bona fide resident of Puerto Rico for the entire taxable year.
[36] “Publicly available Internal Revenue Service (IRS) data indicate residents of Puerto Rico had been paying “income taxes” to the federal treasury since at least 1939” (Vargas-Ramos et al., 2024, p. 7).
[37] See the Internal Revenue Code (2023b) in the “References” section of this report.
[38] Data from the Puerto Rico Department of the Treasury indicate that Puerto Rico did not receive a single cent of the customs revenues collected by U.S. Customs and Border Protection (CBP) between 2016 and 2024. On the other hand, available data from the U.S. International Trade Commission show that, during that same period, CBP collected more than $1,700 million in tariffs applied to merchandise entering Puerto Rico. Stewart (2025) asks: “Where has this money gone? … The people of Puerto Rico deserve a full report on all customs revenue collected and how it is disbursed. There is a need for an accurate and public time series on the annual collection and distribution of these funds, a specification of how CBP calculates the cost of collection, as well as public disclosure of all memoranda of understanding between the governments of the United States and Puerto Rico in relation to this matter.”
[39] The information comes from the chart Duties collected on imports to Puerto Rico and the share covered over to the PR Treasury 1996–2023, whose source is https://dataweb.usitc.gov (Stewart, 2024) and from J. Stewart (personal communication, June 17, 2025). In response to a Freedom of Information Act request regarding customs duties collected in Puerto Rico, U.S. Customs and Border Protection (CBP) provided a document corresponding to federal fiscal year 2023 (October 1, 2022 to September 30, 2023). The data are broken down by Harmonized Tariff Schedule code and description, with a ±4% margin of error. The total estimated duty reported by CBP for fiscal year 2023 is $286,852,077 (Andrés I. García, personal communication, August 1, 2025). This information was received while the Spanish version of the report was already in press; therefore, the updated figure is acknowledged in this note in the English version, but the original estimate of $250 million remains in the body and tables of the document due to timing constraints.
[40] The United States Court of Appeals for the Fifth Circuit determined, on July 24, 2024, that the program’s funding mechanism is unconstitutional. In its decision in Consumers’ Research v. FCC, that court concluded that the way in which the Federal Communications Commission’s funding mechanism constitutes an unconstitutional delegation of Congress’s taxing power. On June 27, 2025, the United States Supreme Court, in a 6–3 decision, overturned the Fifth Circuit’s ruling and upheld the constitutionality of the Federal Universal Service Fund, “a charge that has been included on telephone bills” for almost 30 years (Sherman, 2025).
[41] Some of these rates are adjusted for inflation, and certain sections of the law expire and require periodic congressional action.
[42] This situation is not unique to Puerto Rico and has been documented in other studies.
[43] The OECD considers the municipal license tax (patente) to be a consumption tax, whose effective incidence is on the consumer, although the legal incidence is on the business. The establishment pays the patente based on its gross receipts. If it sets its profit margin after taxes, it will pass the cost of the patente on to the consumer through its pricing structure. Although it is not charged directly to the buyer, the tax is indirectly transferred as part of the final product price.
[44] This process does not imply an extraction of wealth or national resources, but rather the return on investment made by individuals or private entities.
[45] To calculate the tax burden by economic sectors, such as consumers and businesses, it is recommended to use GNP for local sectors and GDP for foreign companies.
[46] This ambiguity and imprecision was found, for example, in the types and rates of the “Sales and Use Tax and on Imports.” After examining the Puerto Rico Tax Justice Act of 2006 (2006) and the Puerto Rico Internal Revenue Code of 2011 (2011/2025), it was necessary to turn to Form AS 2915.1 Sales and Use Tax and Tax on Imports Monthly Return (Departamento de Hacienda, 2022) to precisely determine the types and rates of this tax.
[47] Some researchers recommend that policymakers adjust tax rates to increase levels of voluntary compliance. This conclusion is supported by different scholars who stated that, in most developing countries, tax rates are so high that they discourage tax compliance (Chindengwike, 2022; Deyganto, 2018; White, 2010).
[48] Local taxes in the United States can be applied on very small spatial scales; for example, Plantation Walk—a complex integrating retail, dining, entertainment, and residential spaces in South Florida—has a tax called the Plantation Walk Marketing and Entertainment Fee of 1%. This charge, approved by the City of Plantation, is included in the lease agreements of all tenants and is collected by each establishment from consumers as a sales tax in addition to the state tax. Its purpose is to fund activities such as free concerts and car exhibitions.
[49] “Between 2012 and 2014, Texas ran TV ads in California, Illinois and New York urging businesses and high-income taxpayers to relocate. Governor Rick Perry visited dozens of California companies to pitch Texas’ low taxes, famously declaring: “Texas rewards success with no state income tax”” (Moretti & Wilson, 2017, p. 1).
[50] The cited United States Department of Commerce publication describes the change from GNP to GDP and provides information on how GNP and GDP differ conceptually in monetary terms.
[51] The CRIM has identified (a) approximately 200,000 real properties outside the registry (new or unreported); (b) countless improvements—such as terraces, pools, and extensions—not appraised; and (c) undue exemptions that result in a reduction in collections. On the other hand, nearly 80% of the properties that have been added to the CRIM inventory have been primary residences, so many benefit from tax exemption or some type of exclusion (Pérez, 2025).
[52] Own calculations based on data from Personal Income by State (BEA, 2025) and Table 1. State and Local Government Finances by Level of Government and by State: 2022 (USCB, 2022).
[53] A comparable situation is observed in other states without individual income taxes, such as Florida, where consumption taxes account for 51.5% of total revenues, and Alaska, which relies on “Other taxes” for 42.8% of its revenue.
[54] The data originate from a special report by the Oficina de Presupuesto de la Asamblea Legislativa (Budget Office of the Legislative Assembly), led by economists Edwin R. Ríos and Jesús D. Tirado Garay, analyzing the economic and fiscal impact of net migration in Puerto Rico over the past 15 years. The report demonstrates that population decline has economic and fiscal consequences for the country, affecting the labor market and the production of goods and services (2024, p. 3).
[55] An adequate, efficient tax system “that strikes a balance between economic needs and social obligations can be determined by evaluating the influence of tax burden on the degree of economic freedom” (Hlushchenko et al., 2024, p. 73).
[56] A statistical exercise involving regression and correlation analysis was conducted to measure the relationship between the variables.
[57] The table presents the top and bottom five states according to the all-government index Area 2 “Taxes” scores, listed alphabetically. Data from Economic Freedom of North America 2024 indicate a general relationship between lower tax burdens and higher economic freedom.
[58] This amount excludes special excise taxes collected by the U.S. Customs and Border Protection and the Alcohol and Tobacco Tax and Trade Bureau.
[59] This calculation was validated using data published by the OECD (2024).
[60] Even under a common tax structure, fiscal revenues may differ substantially across jurisdictions. The absolute level of revenue collection does not depend solely on tax rates. Per capita tax comparisons must account for the underlying economic context.
[61] “Per capita state and local tax collections must be considered within the broader context of other states’ actions, the current economic realities at play in each individual state, and the future policy priorities of its citizens and legislatures as they seek to maximize their utility and provide a better life for their residents” (Johns, 2025).
[62] The term subnational refers to the state and local levels of government in both the United States and Puerto Rico; for example, to revenues collected by the Island’s central government and its municipalities.